Introduction to Machine Learning
Learning, Examples,
and Data
An overview of the various forms of data and examples of their use in machine learning
What are* data?
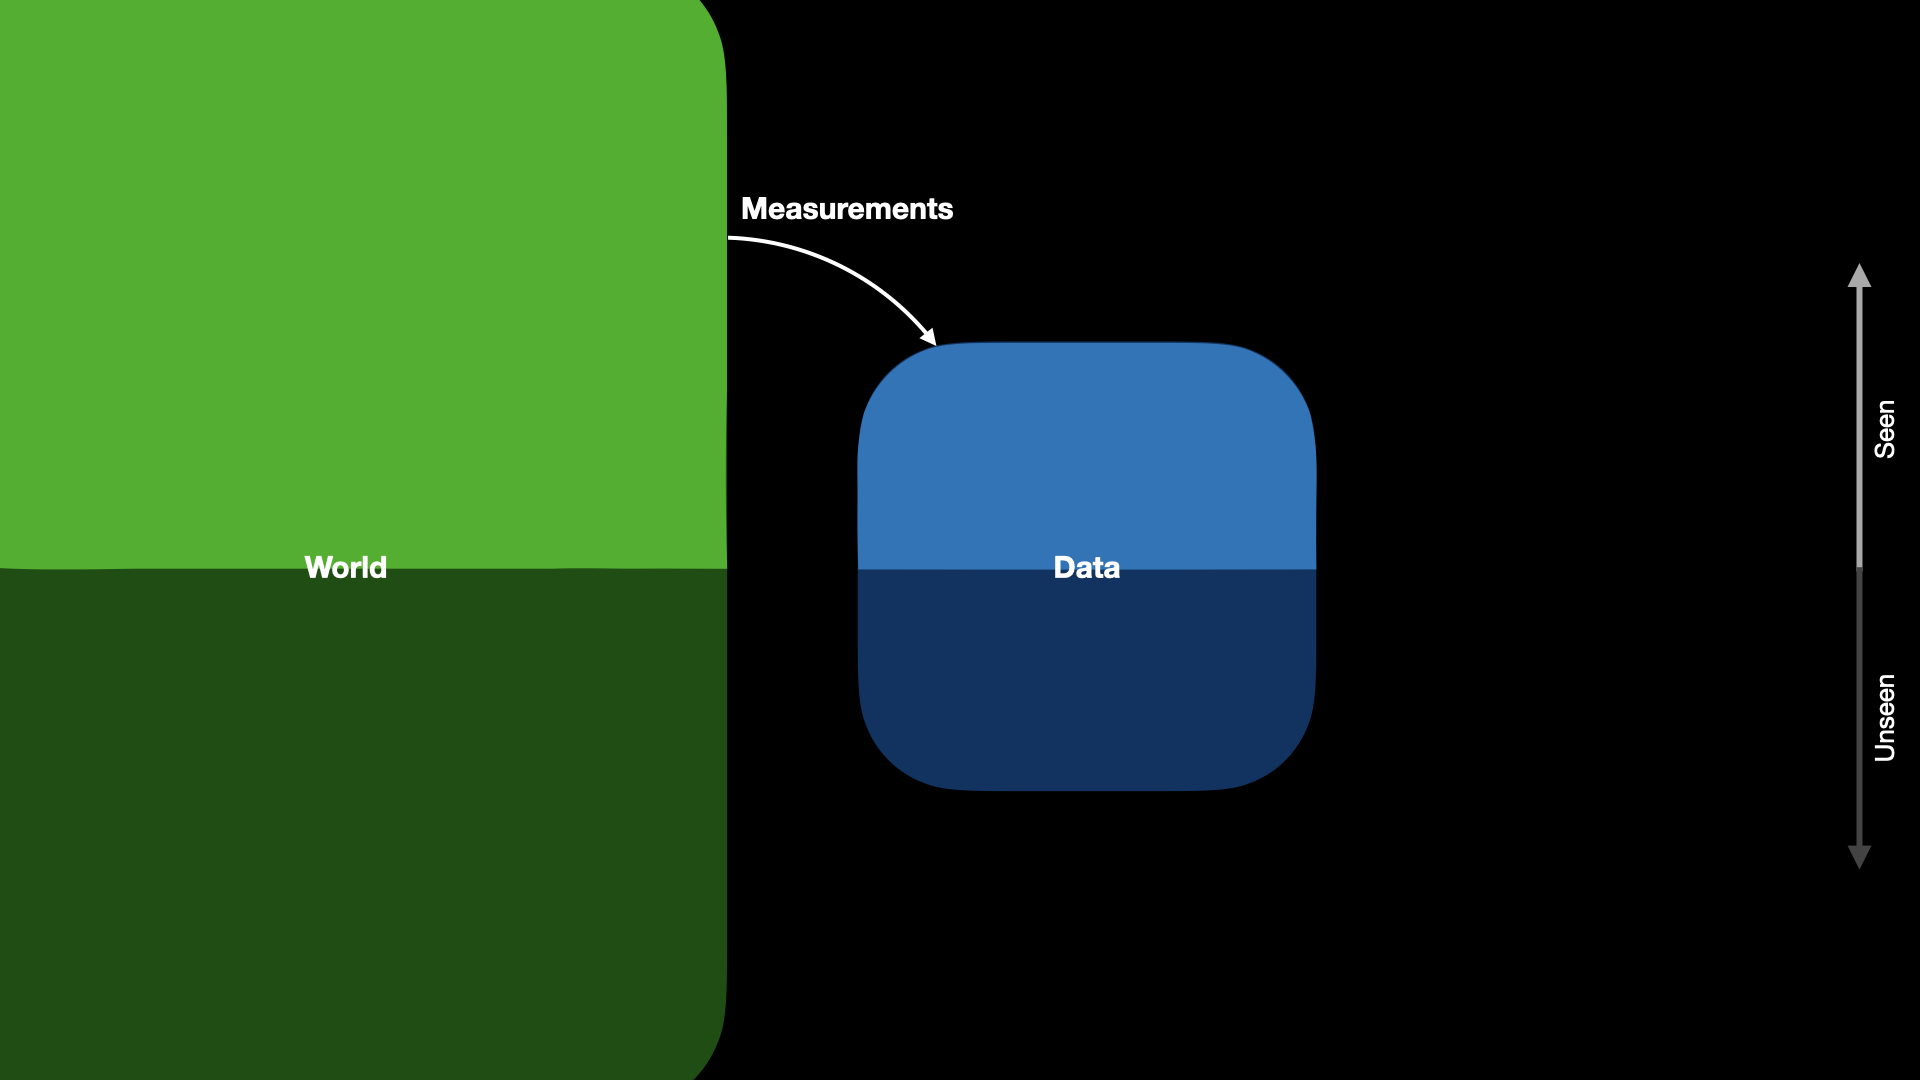
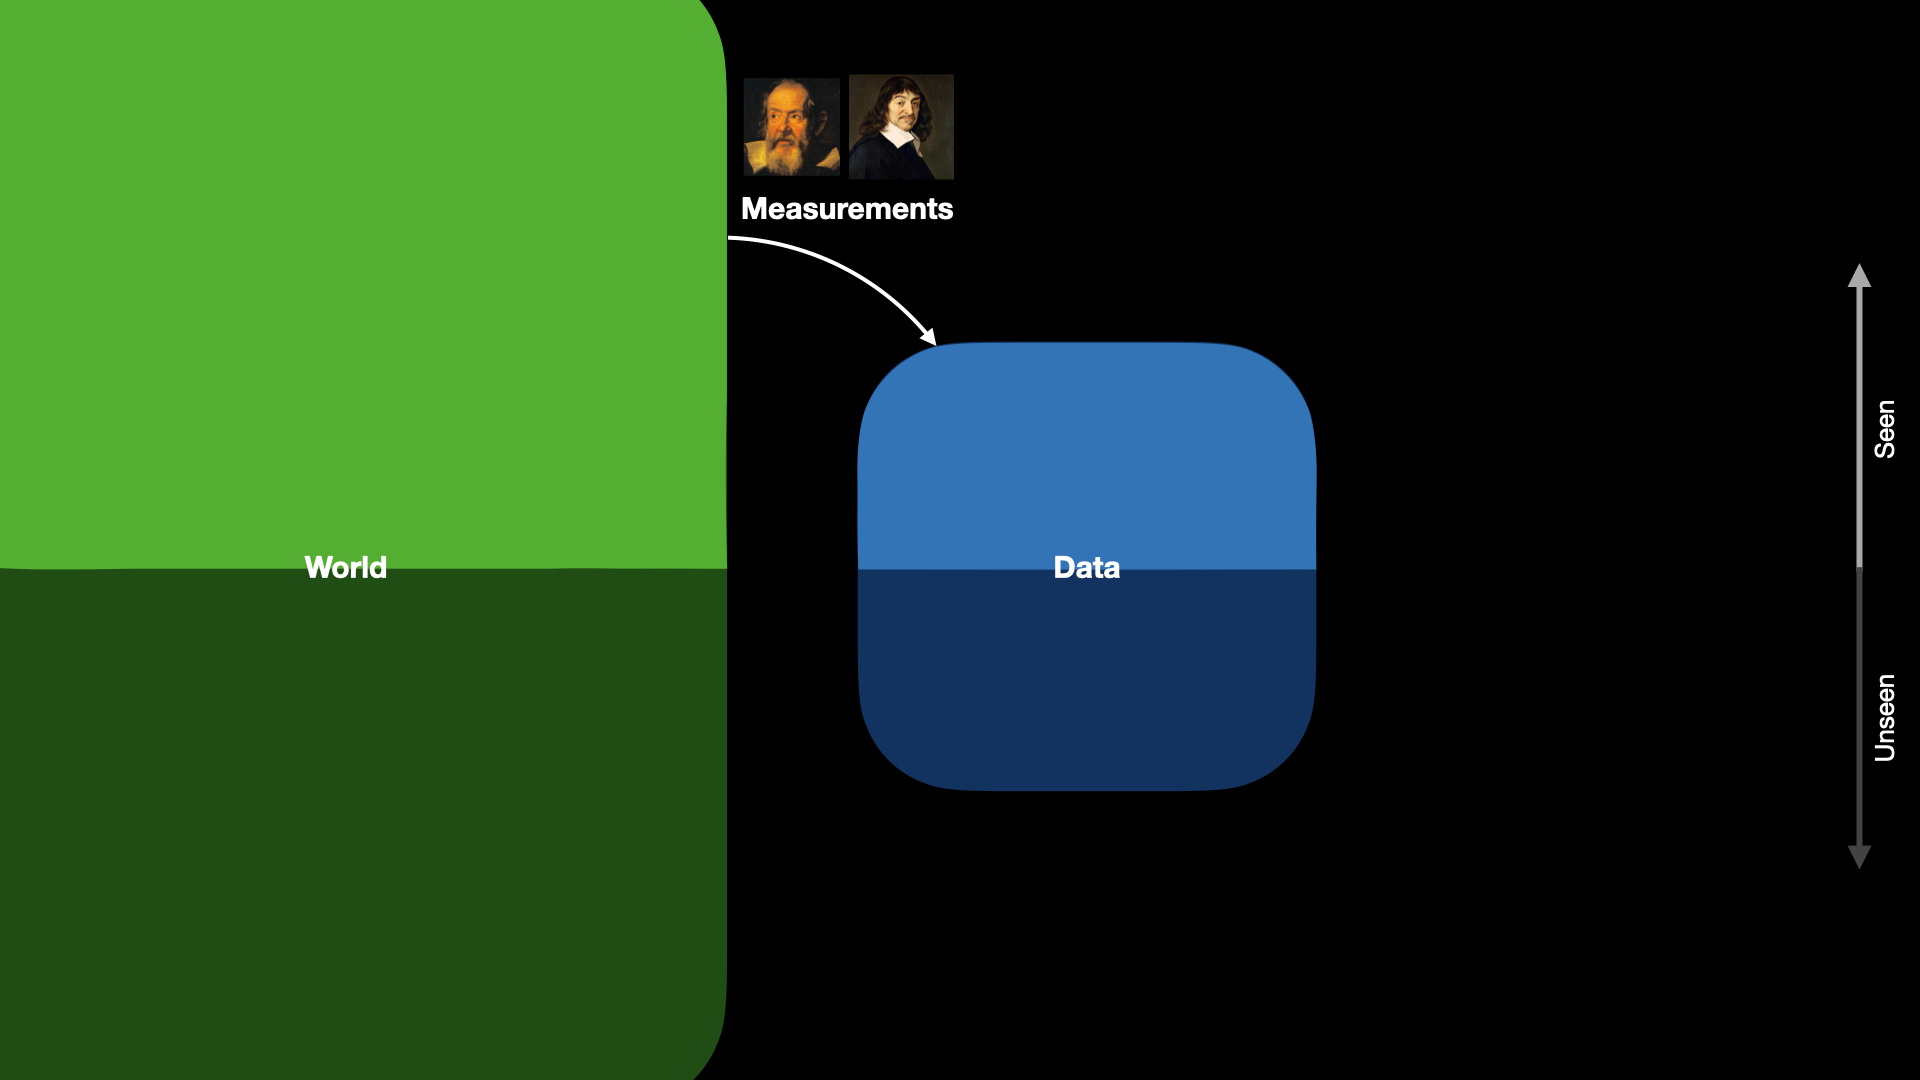
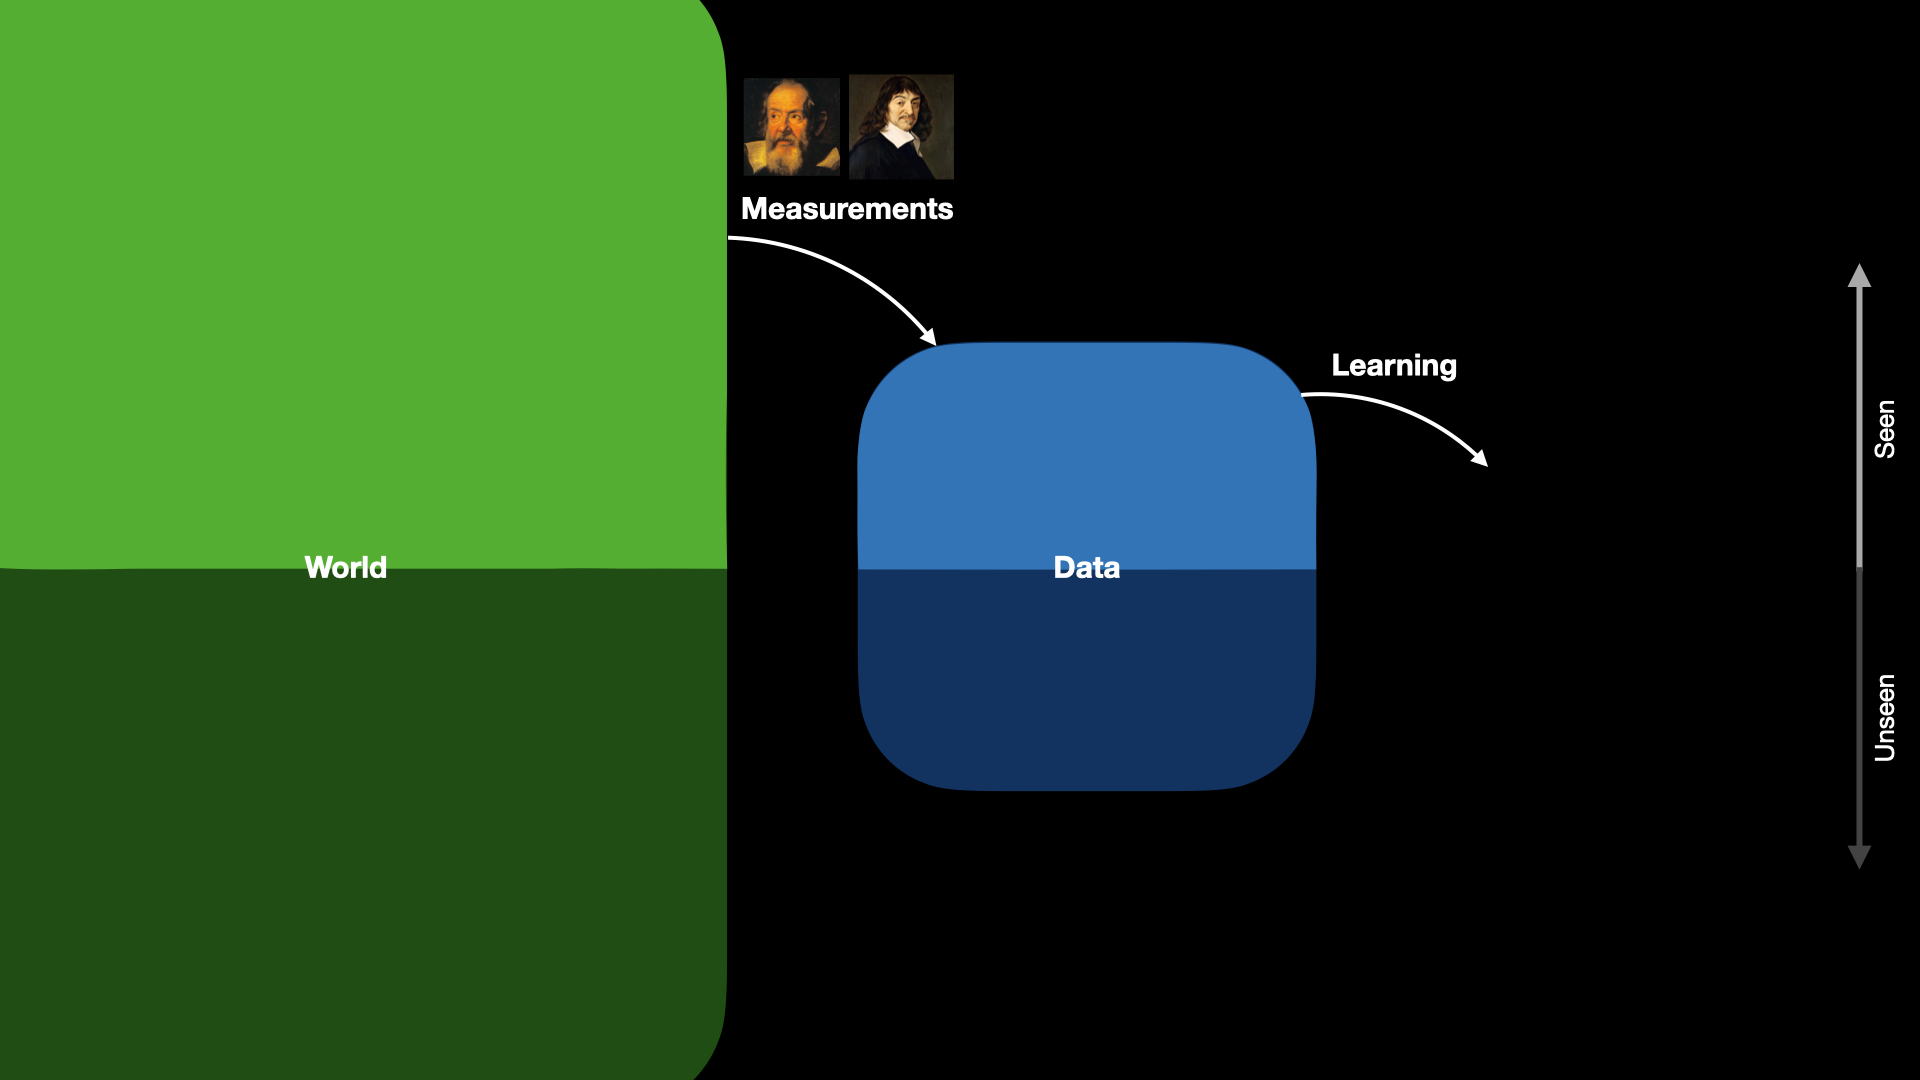
Anything the world leaves behind that we can record.
Today: all of these become numbers.
*one datum, many data
Stocks
hover a row
- A table and a curve: the same object
- Each row is a pair \( (t_i, x_i) \)
Audio
- Speech recognition is a function \( F: \text{array} \rightarrow \text{text} \)
From a Wave to a Picture
The short-time Fourier transform: the first thing anyone does to a sound before modelling it
- The waveform is one number per instant. It hides which frequencies are present.
- Cut the signal into short windows, take the Fourier transform of each, stack them side by side. Now pitch is visible.
- Speech recognisers and birdsong classifiers almost never see the wave. They see this picture.
Images
move your mouse over the image
- A color image is \( h \times w \times 3 \): height, width, and three channels (red, green, blue)
- Your phone: \( 3000 \times 4000 \times 3 = 36 \) million numbers per photo
Colour Is Three Matrices
The grey image was one number per pixel. Colour is three, stacked
- A colour image of height \(h\) and width \(w\) is an array of shape \( h \times w \times 3 \).
- Nothing about it is a picture to the machine. It is three grids of numbers between 0 and 255.
Video
Eadweard Muybridge, 1878: the first time motion was recorded as an array of stills
- One frame is \( h \times w \times 3 \); a clip is \( T \times h \times w \times 3 \)
- One minute of 1080p at 30 fps: about 11 billion numbers
- Muybridge settled a bet: are all four hooves ever off the ground at once? You cannot see it, so he turned it into data.
Frames from The Horse in Motion, Wikimedia Commons, public domain.
Image Recognition
- 2012: Google Brain finds cats in YouTube, unsupervised
- 2014: face recognition reaches 97%
- 2019: deep models match radiologists on lung scans
- 2021: AlphaFold predicts protein structure from sequence
- 2022: text becomes images, and images become text
- 2024: one model reads an image, a page and a recording together
- 2026: two lines of prompt produce fifteen seconds of film
The same training recipe each time, on new data.
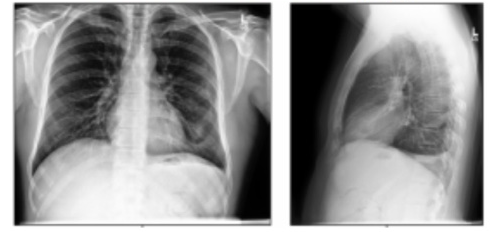
2019: lung cancer detection from chest scans
Ardila et al., Nature Medicine 2019
Text
One-hot word representation
hover a word: its column lights up
- One-hot is honest but lonely: every word equally far from every other
Text
Word embedding representation
Graph Representation
- Maps, molecules, social networks: all matrices, \( A_{ij} = 1 \) when \(i\) connects to \(j\)
A Real Dataset
344 penguins, measured at Palmer Station, Antarctica. Nobody made these numbers up.
- 11 of 344 rows are incomplete; 2 are missing what this plot needs. Which holes matter depends on the question.
- One line for everything says 50 g per mm. Colour by species and it starts to look like an answer to a question nobody asked.
Data: Palmer Penguins, collected by Dr Kristen Gorman, Palmer Station Antarctica LTER. CC0. Download the CSV
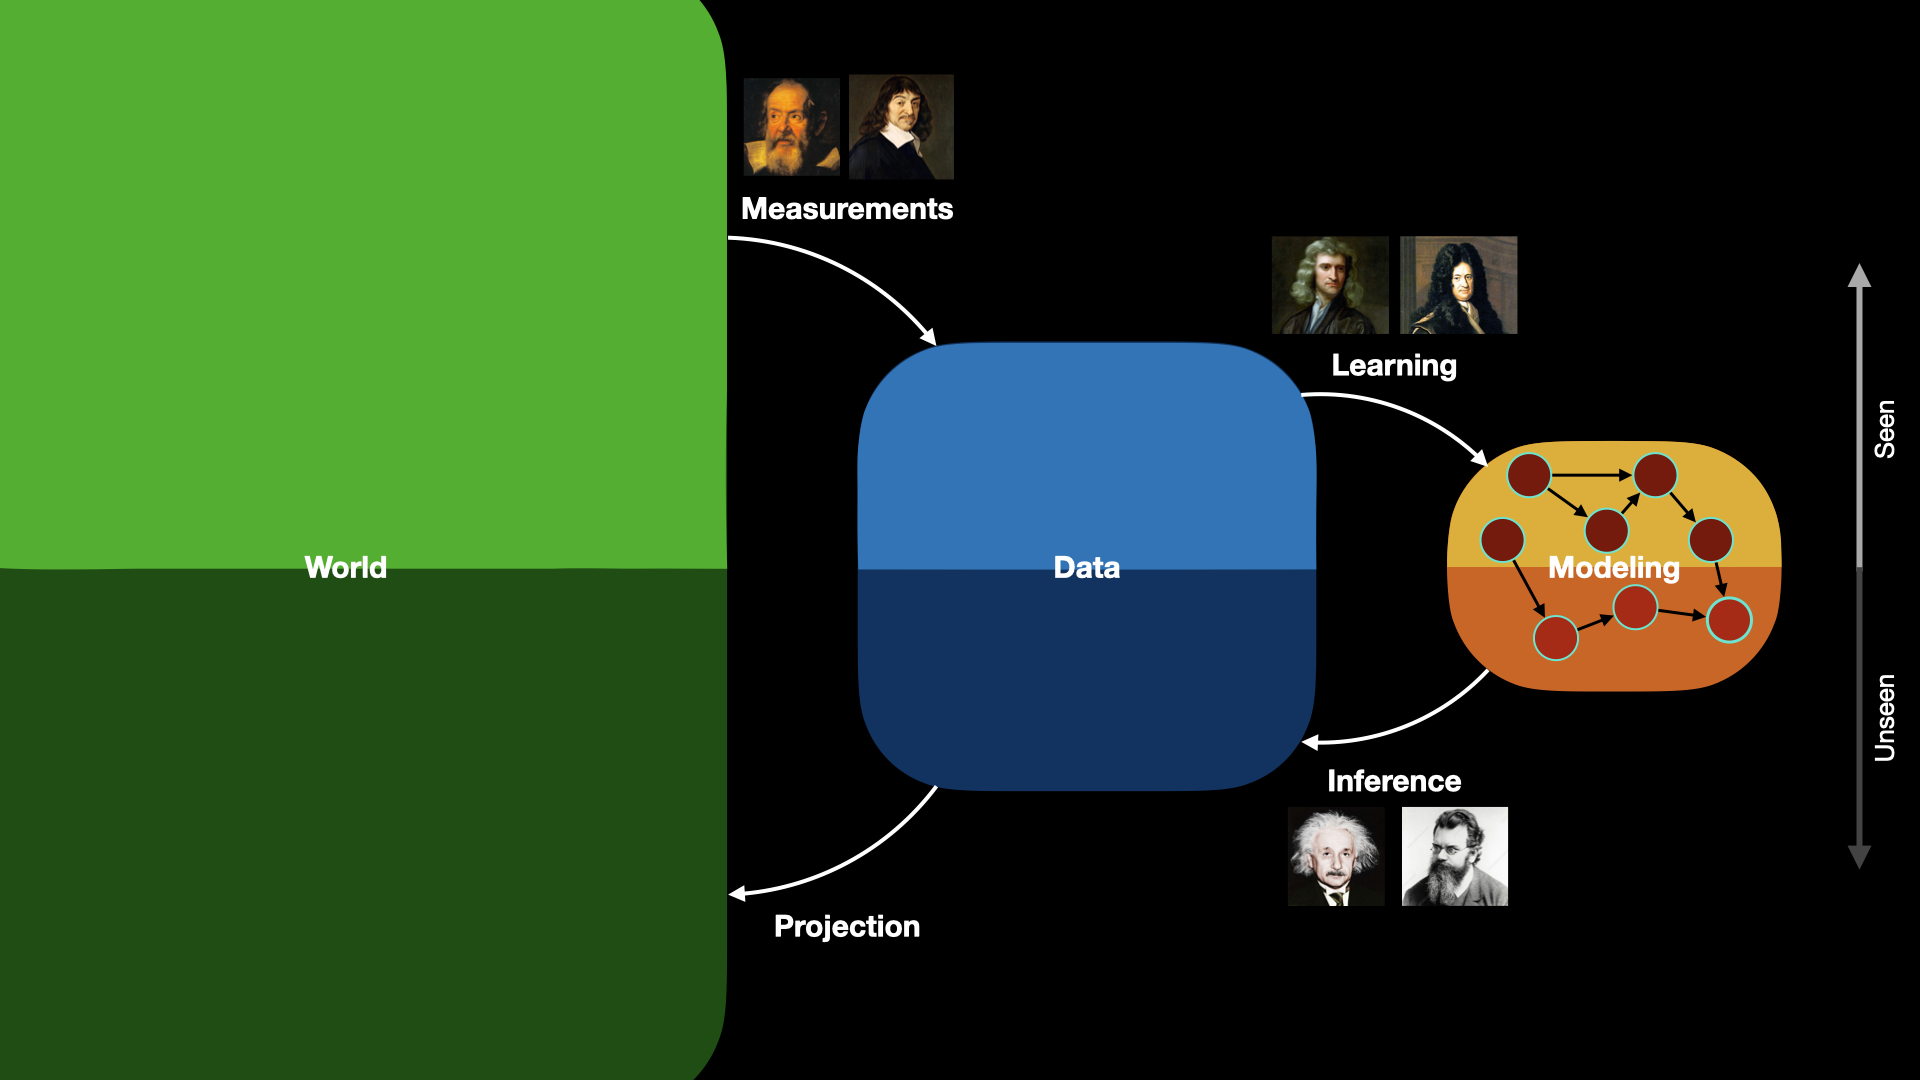
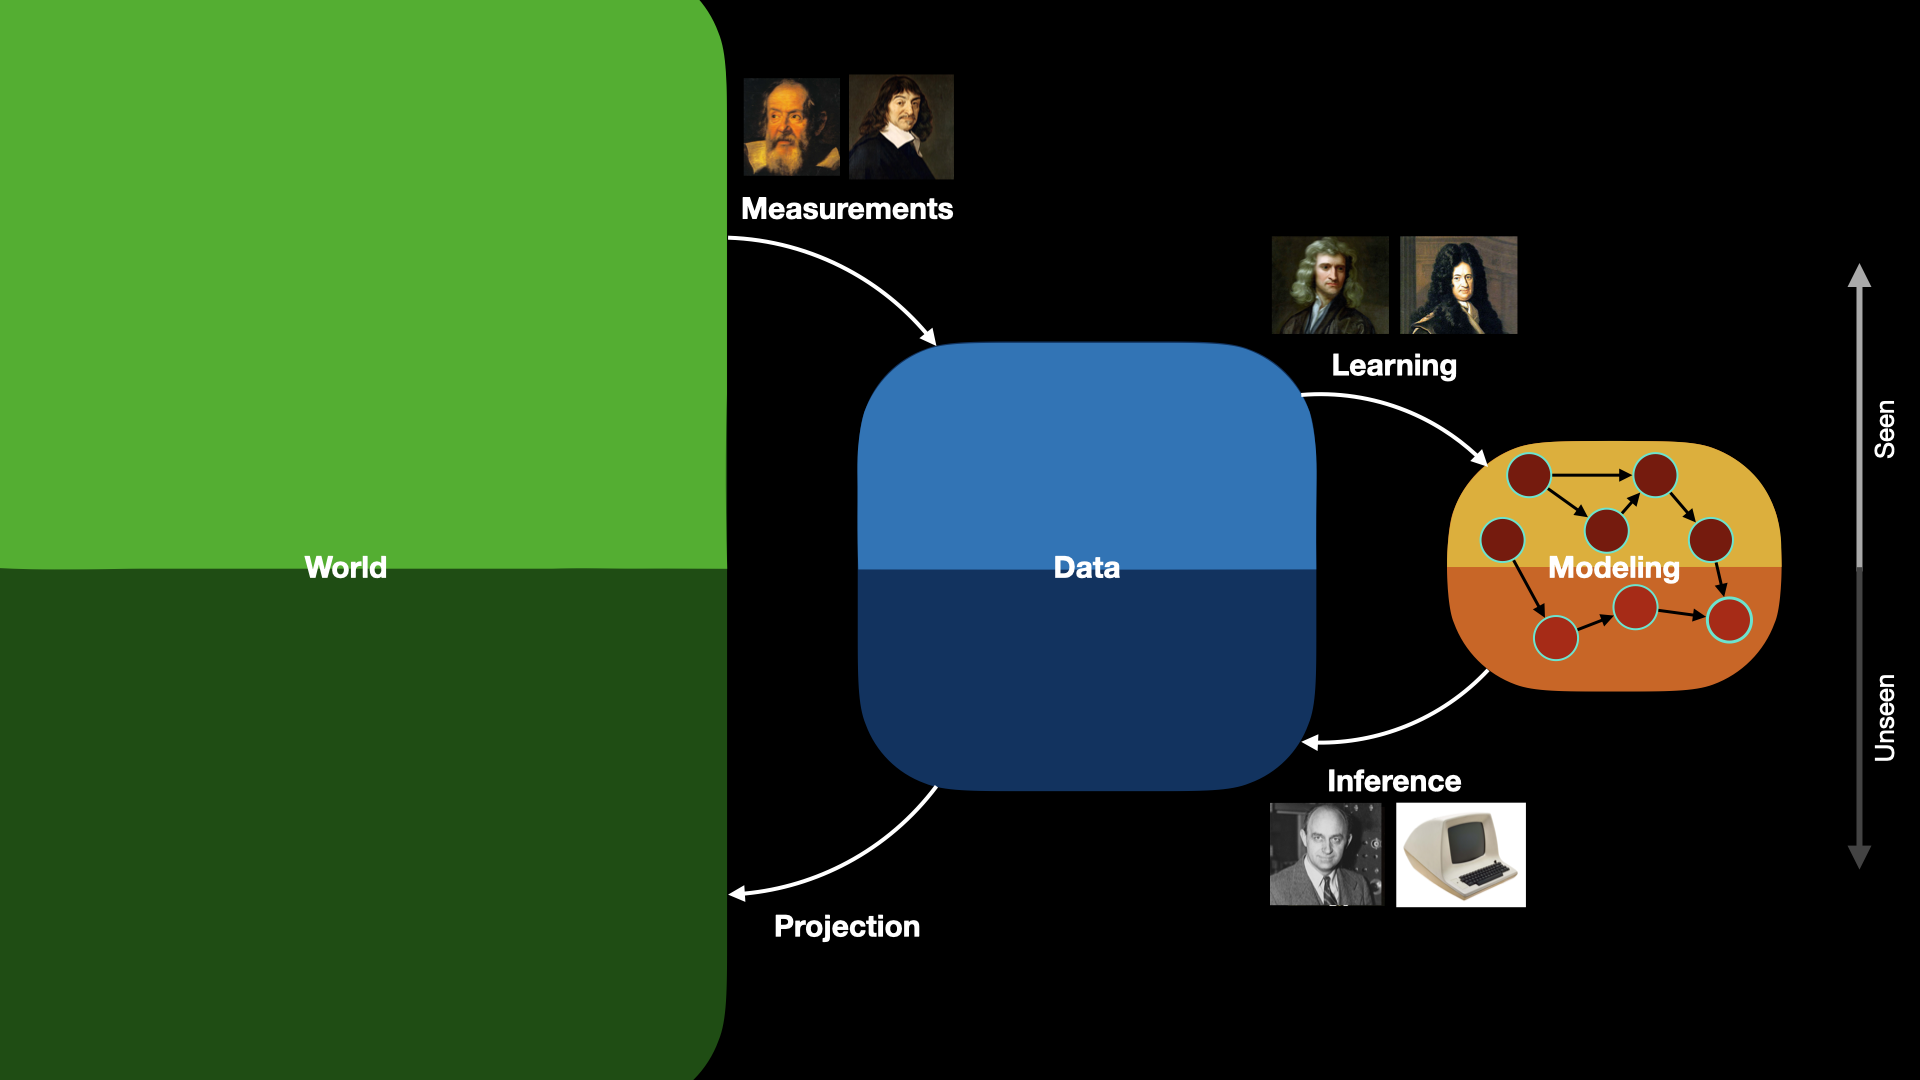
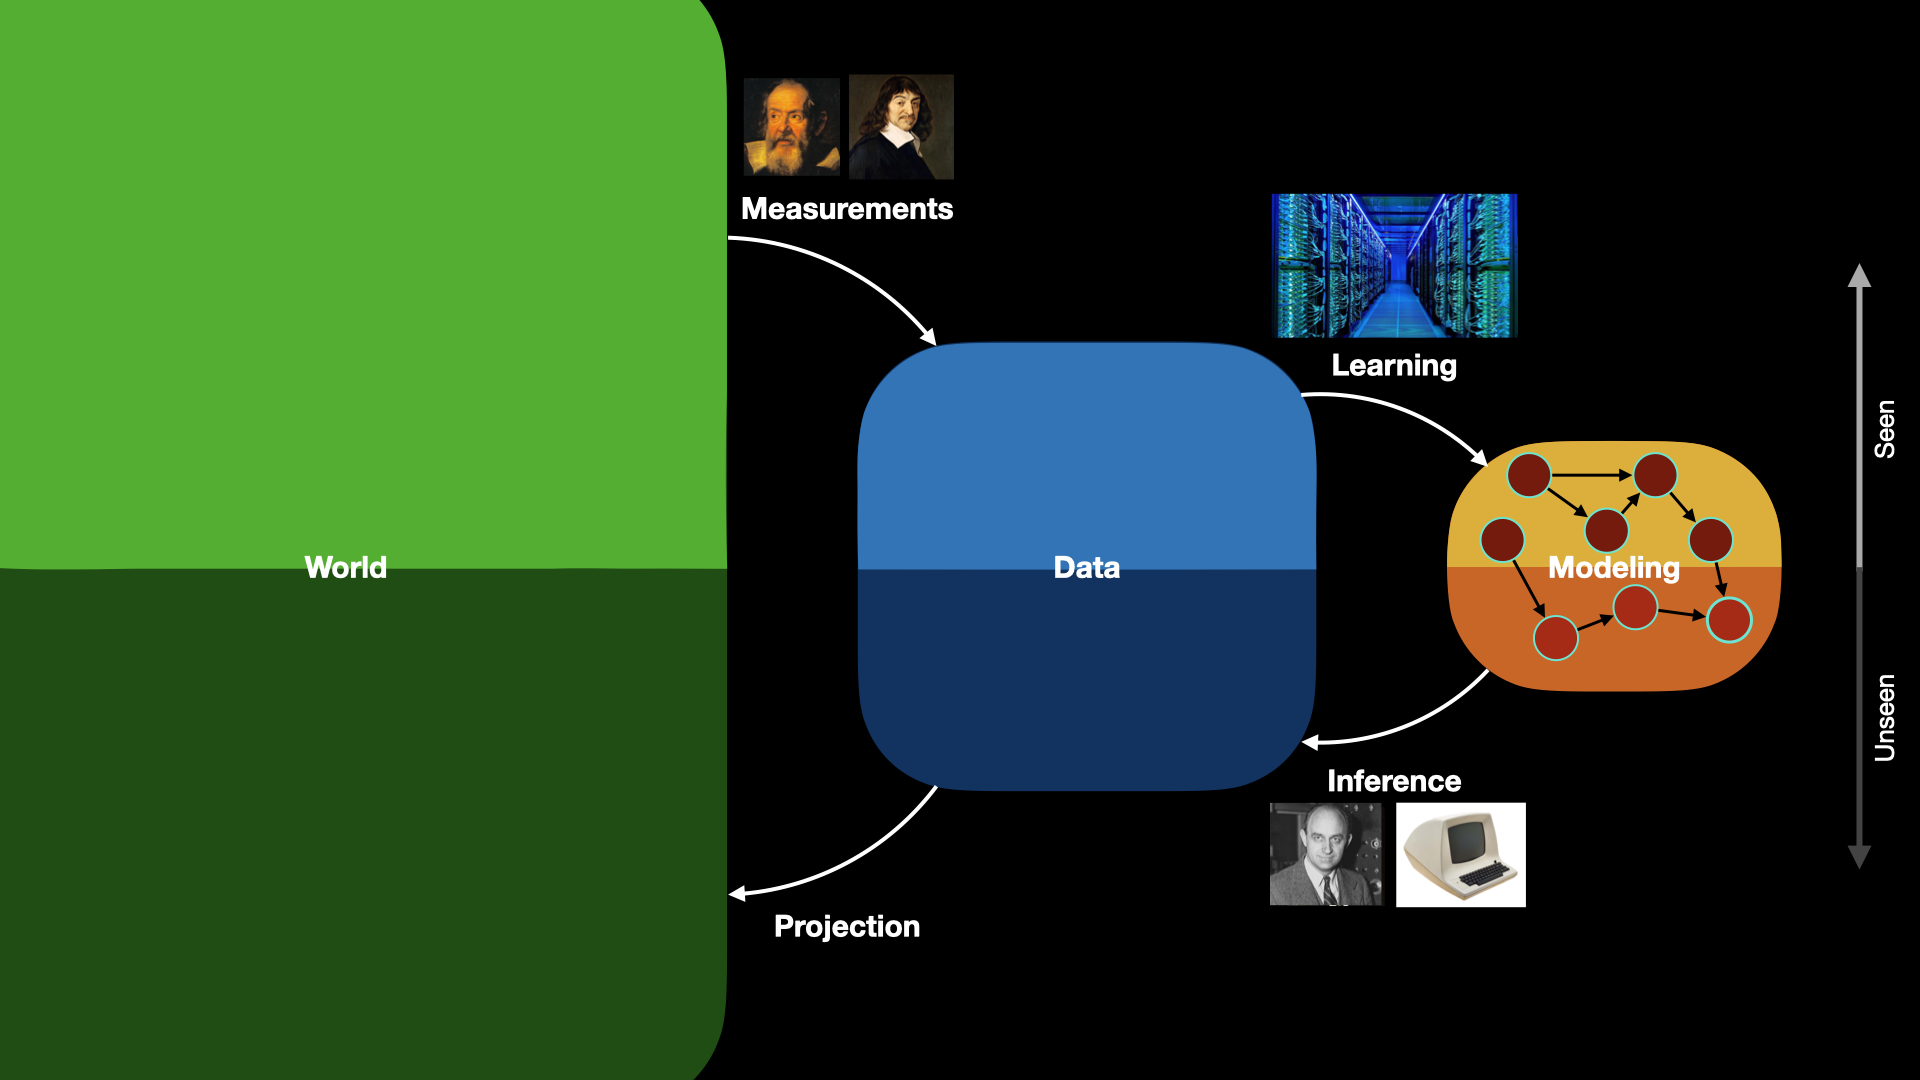
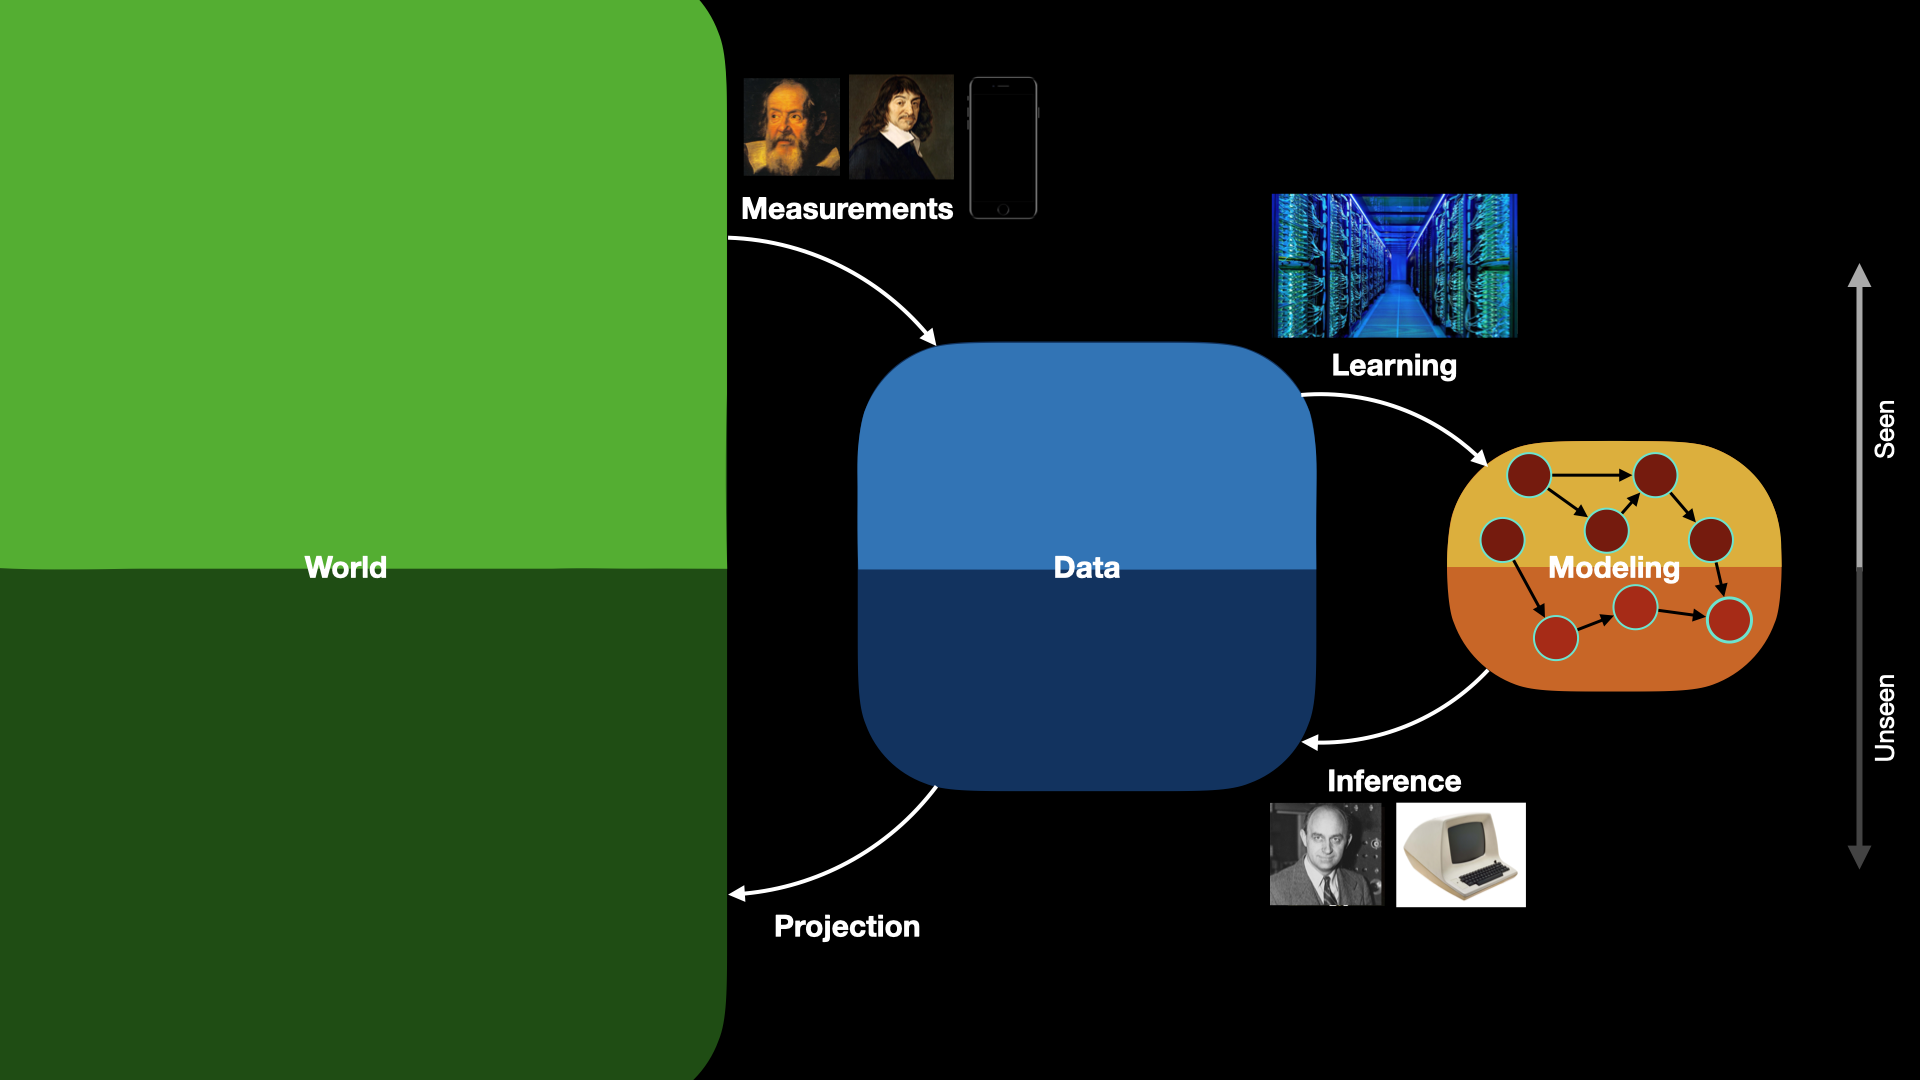
The Three Pillars of Artificial Intelligence
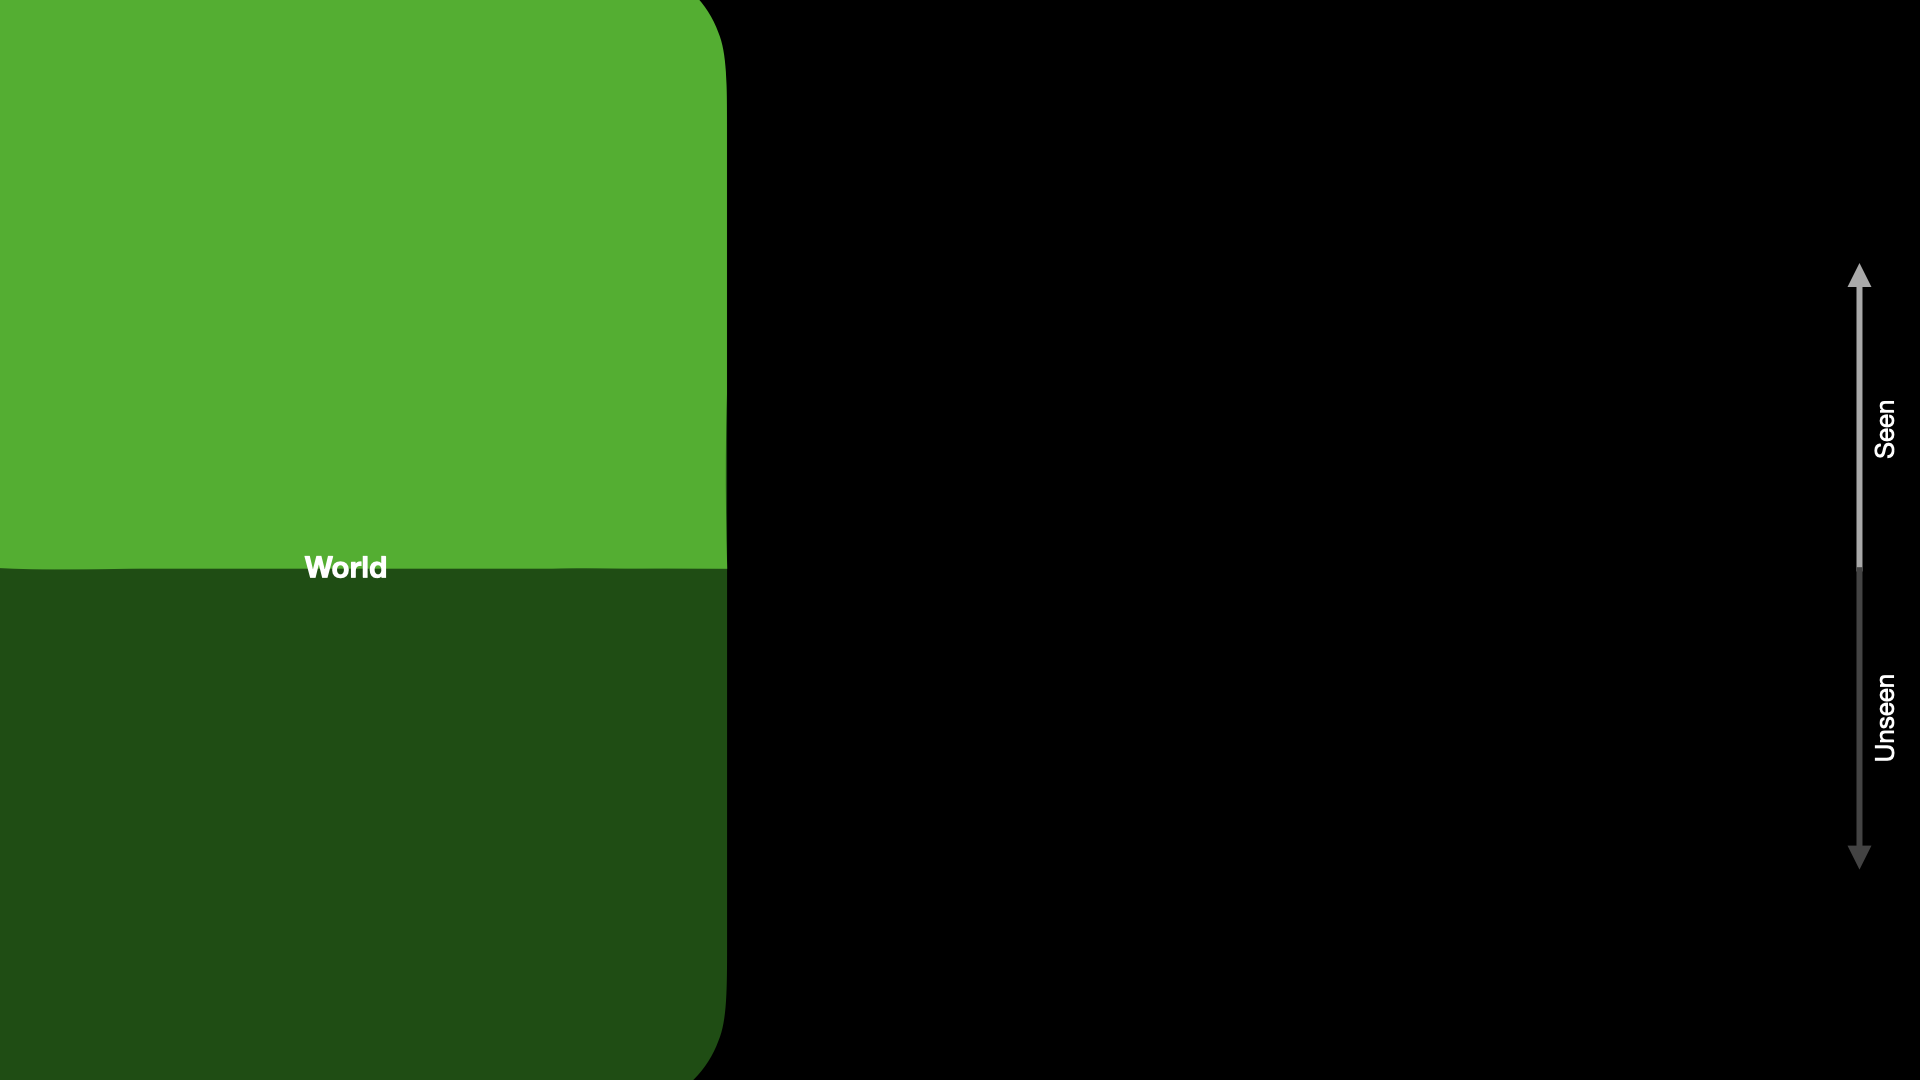
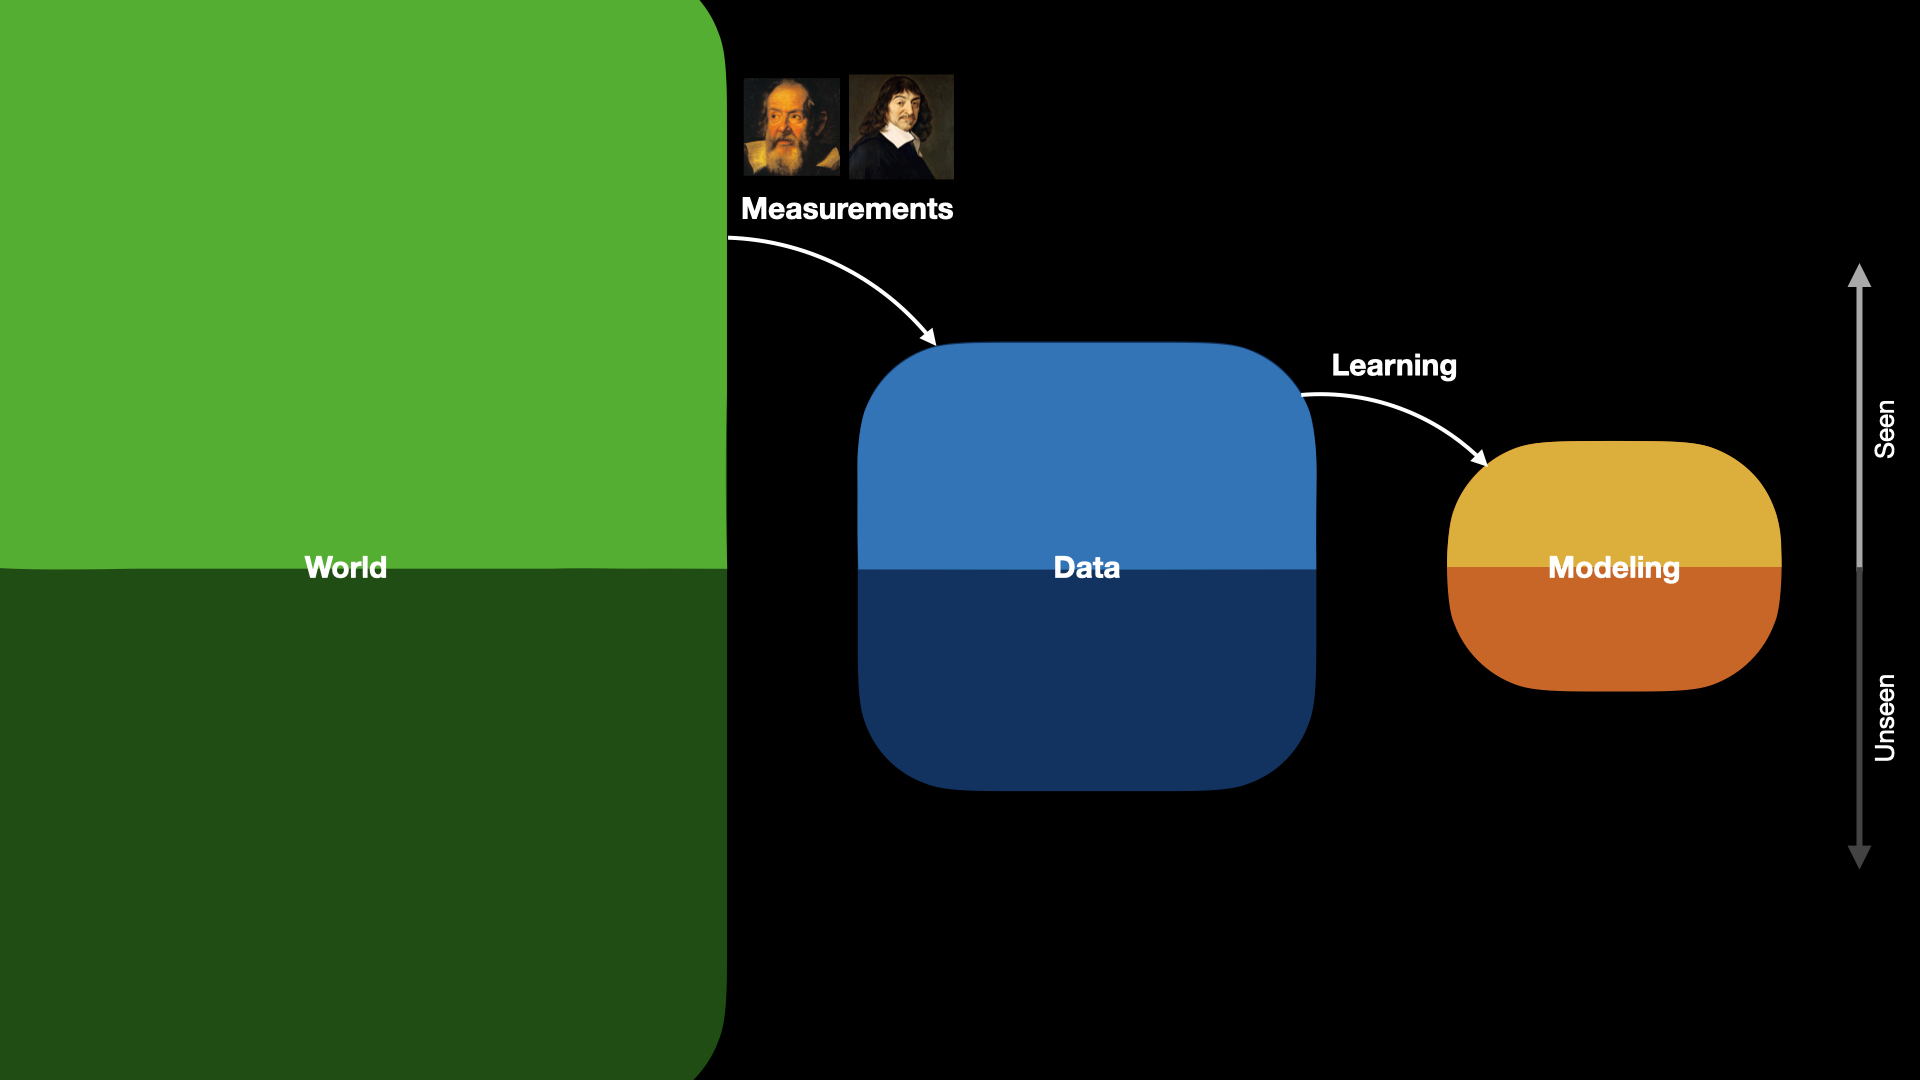
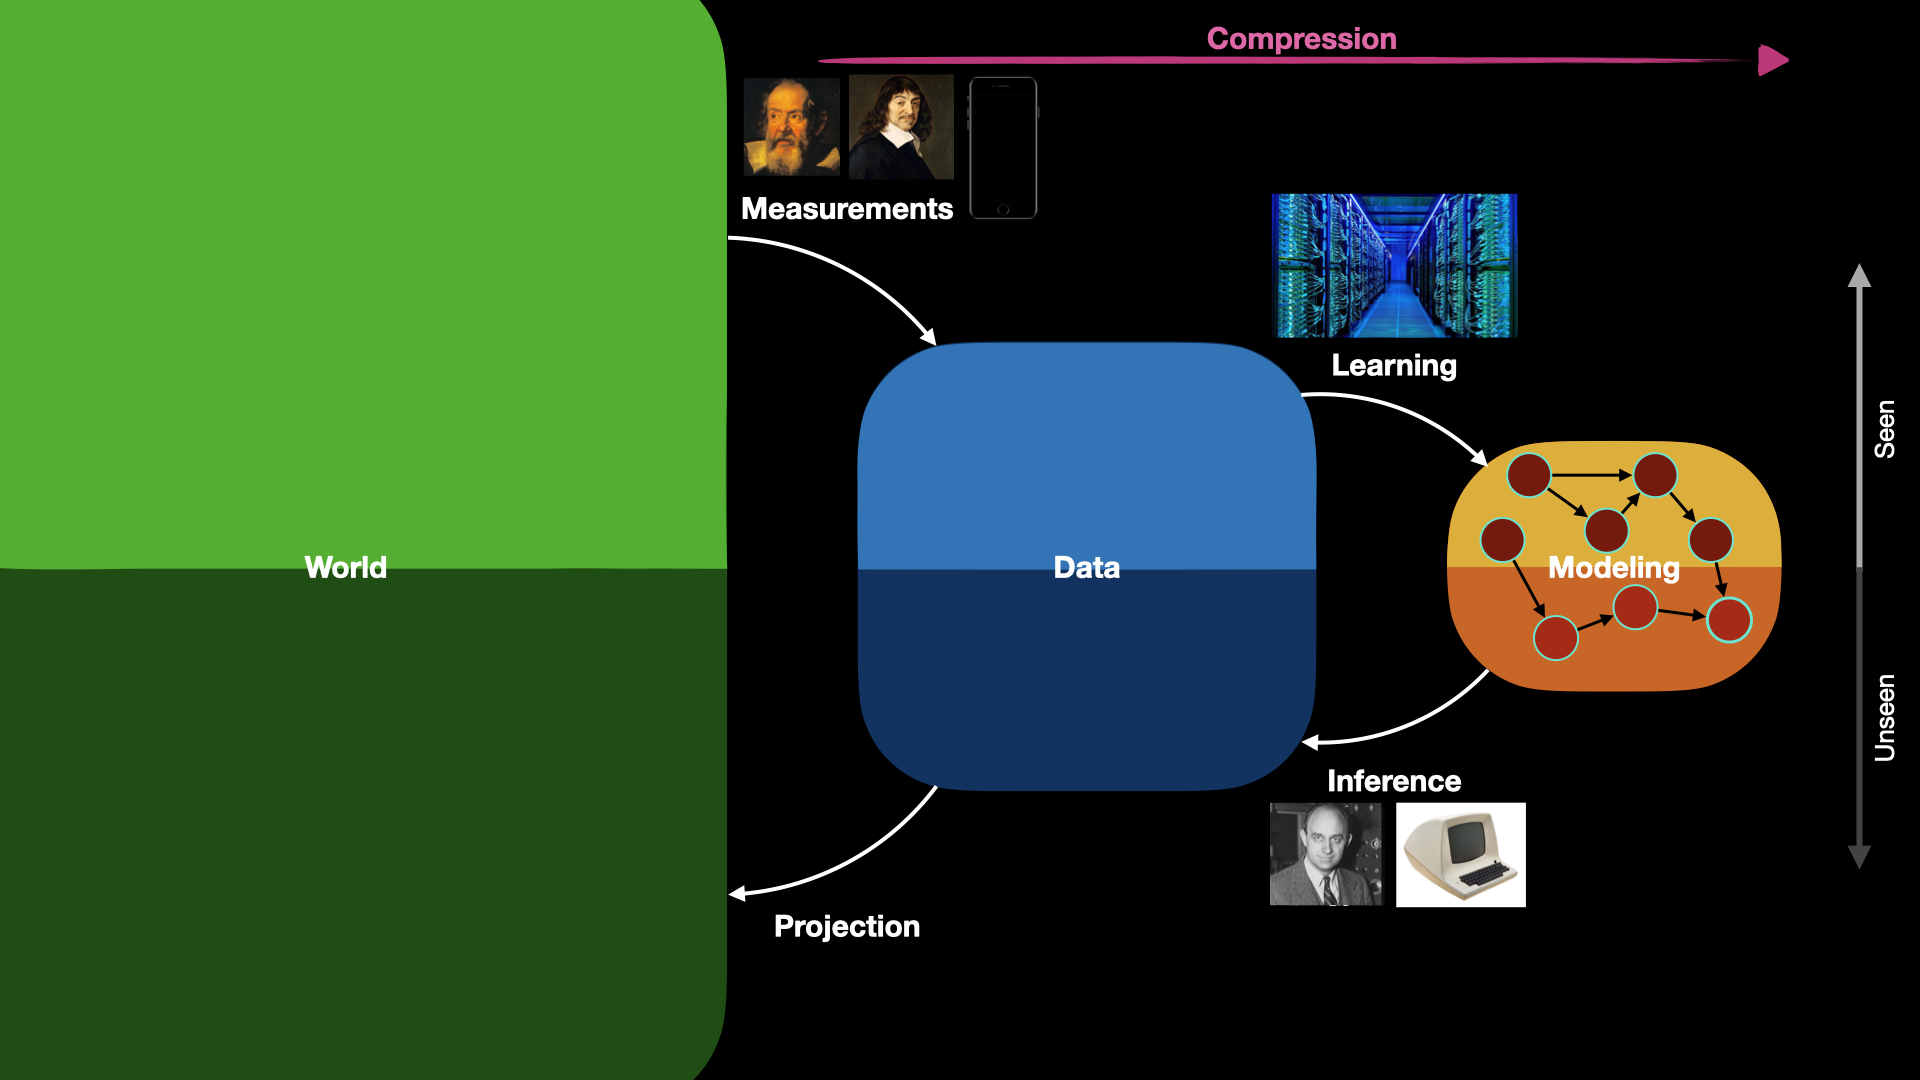
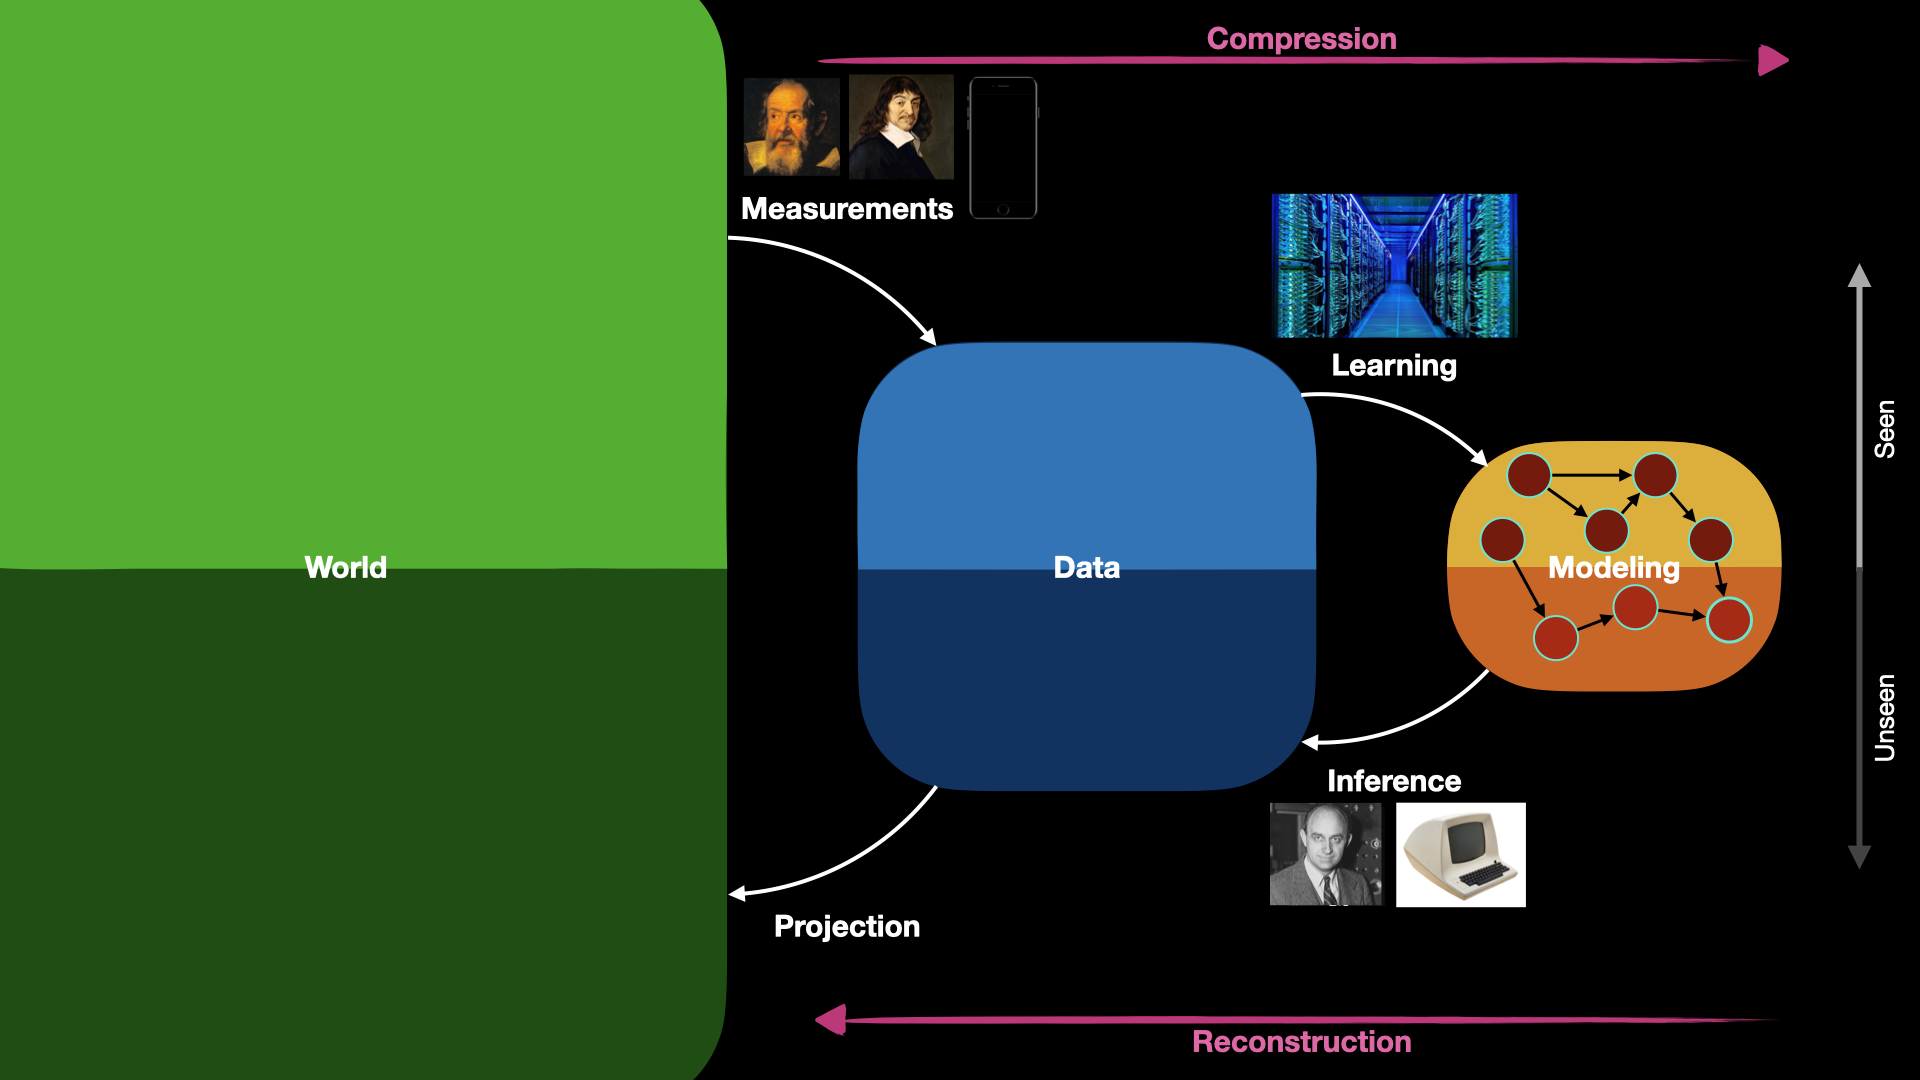
The world is messy. The question is simple: what is the shortest way home?
Classification, Regression, Structured Prediction
Same skeleton every time. Only the shape of \(y\) changes.
Now you: think of one input-output pair from your own life. What is \( x \), what is \( y \), and which of the three is it?
Correlation Coefficient (2 Variables)
- Linear co-movement, from \( -1 \) to \( +1 \)
- \( r = 0 \) means not linear, not unrelated
Histogram and Probability Density Function
Where to Look for Data?
- Curated: Kaggle, UCI, Hugging Face, data.gov
- Collected: sensors, experiments, your phone
- Scraped: the web, politely
import pandas as pd

url = "https://raw.githubusercontent.com/mwaskom/seaborn-data/master/penguins.csv"
df = pd.read_csv(url)

print(df.shape)        # (344, 7): 344 penguins, 7 measurements
print(df.describe())   # your first look at any dataset

Next session
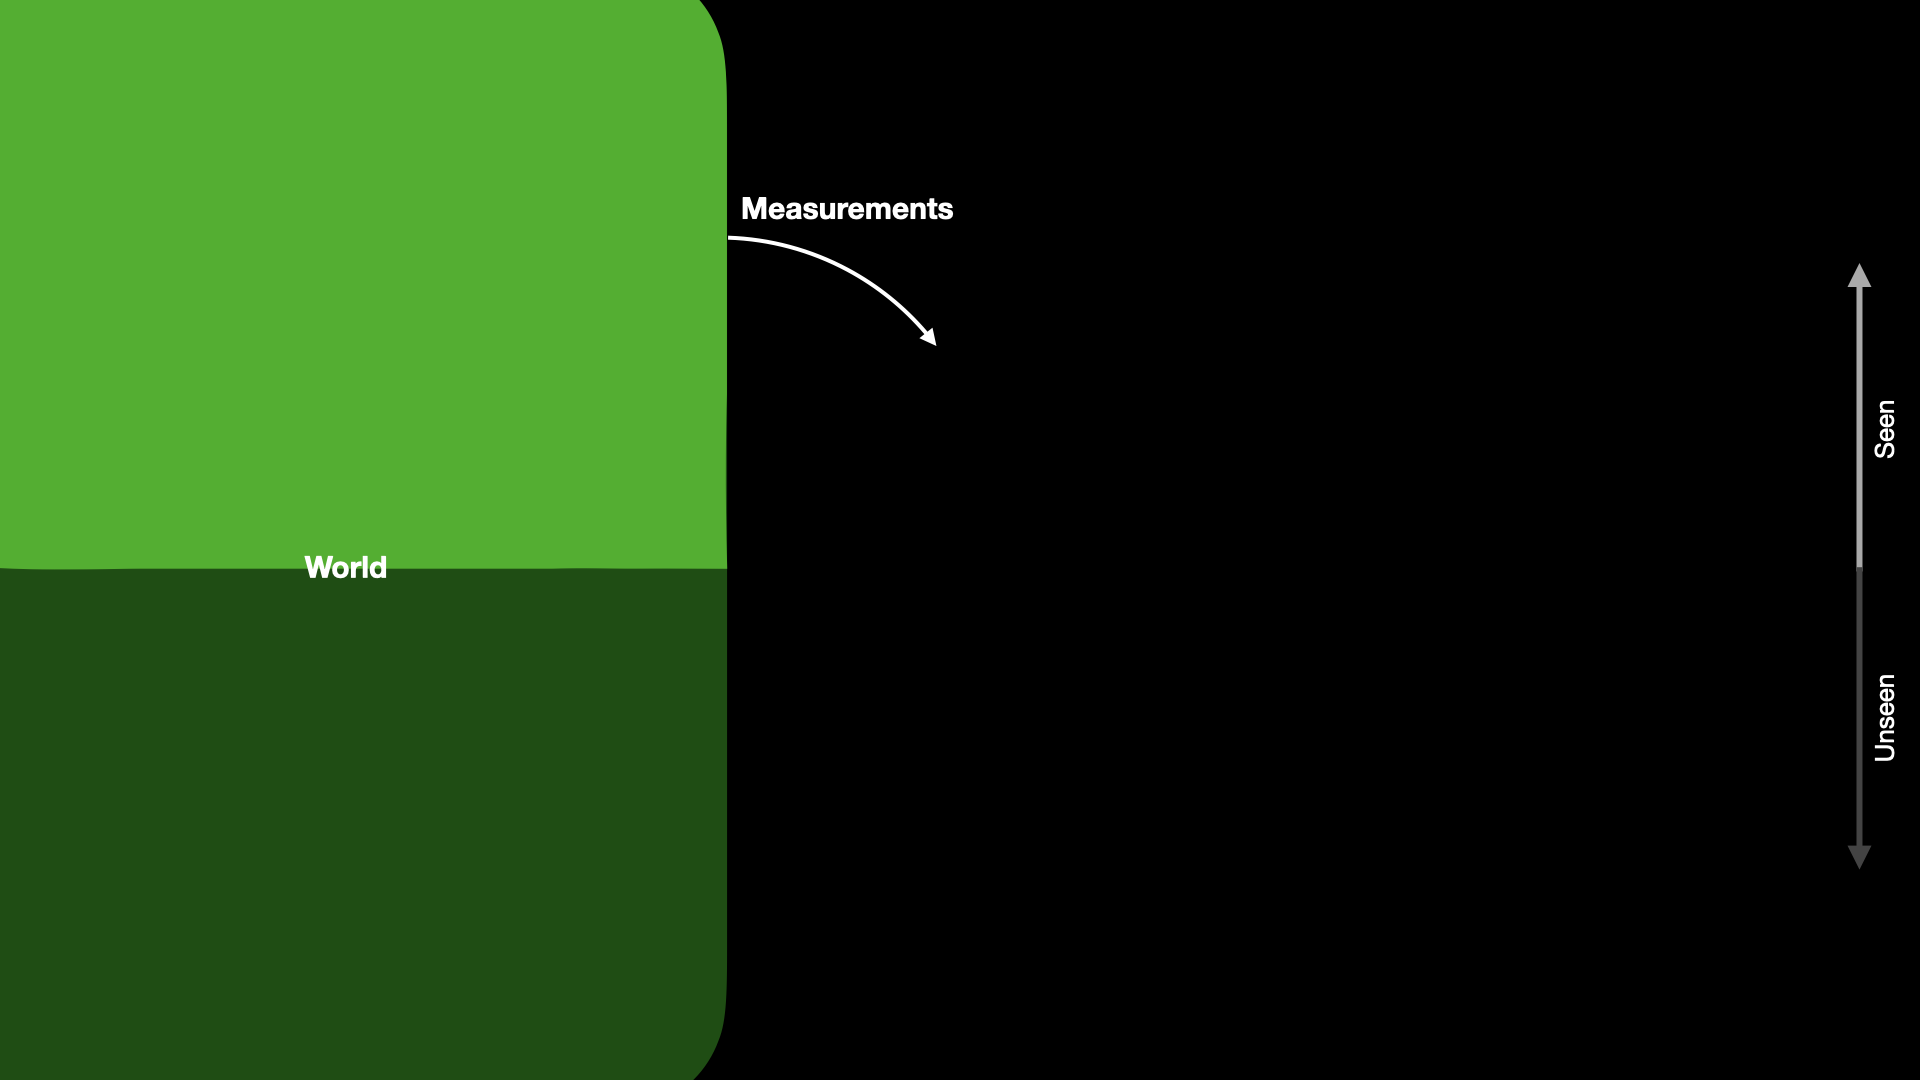
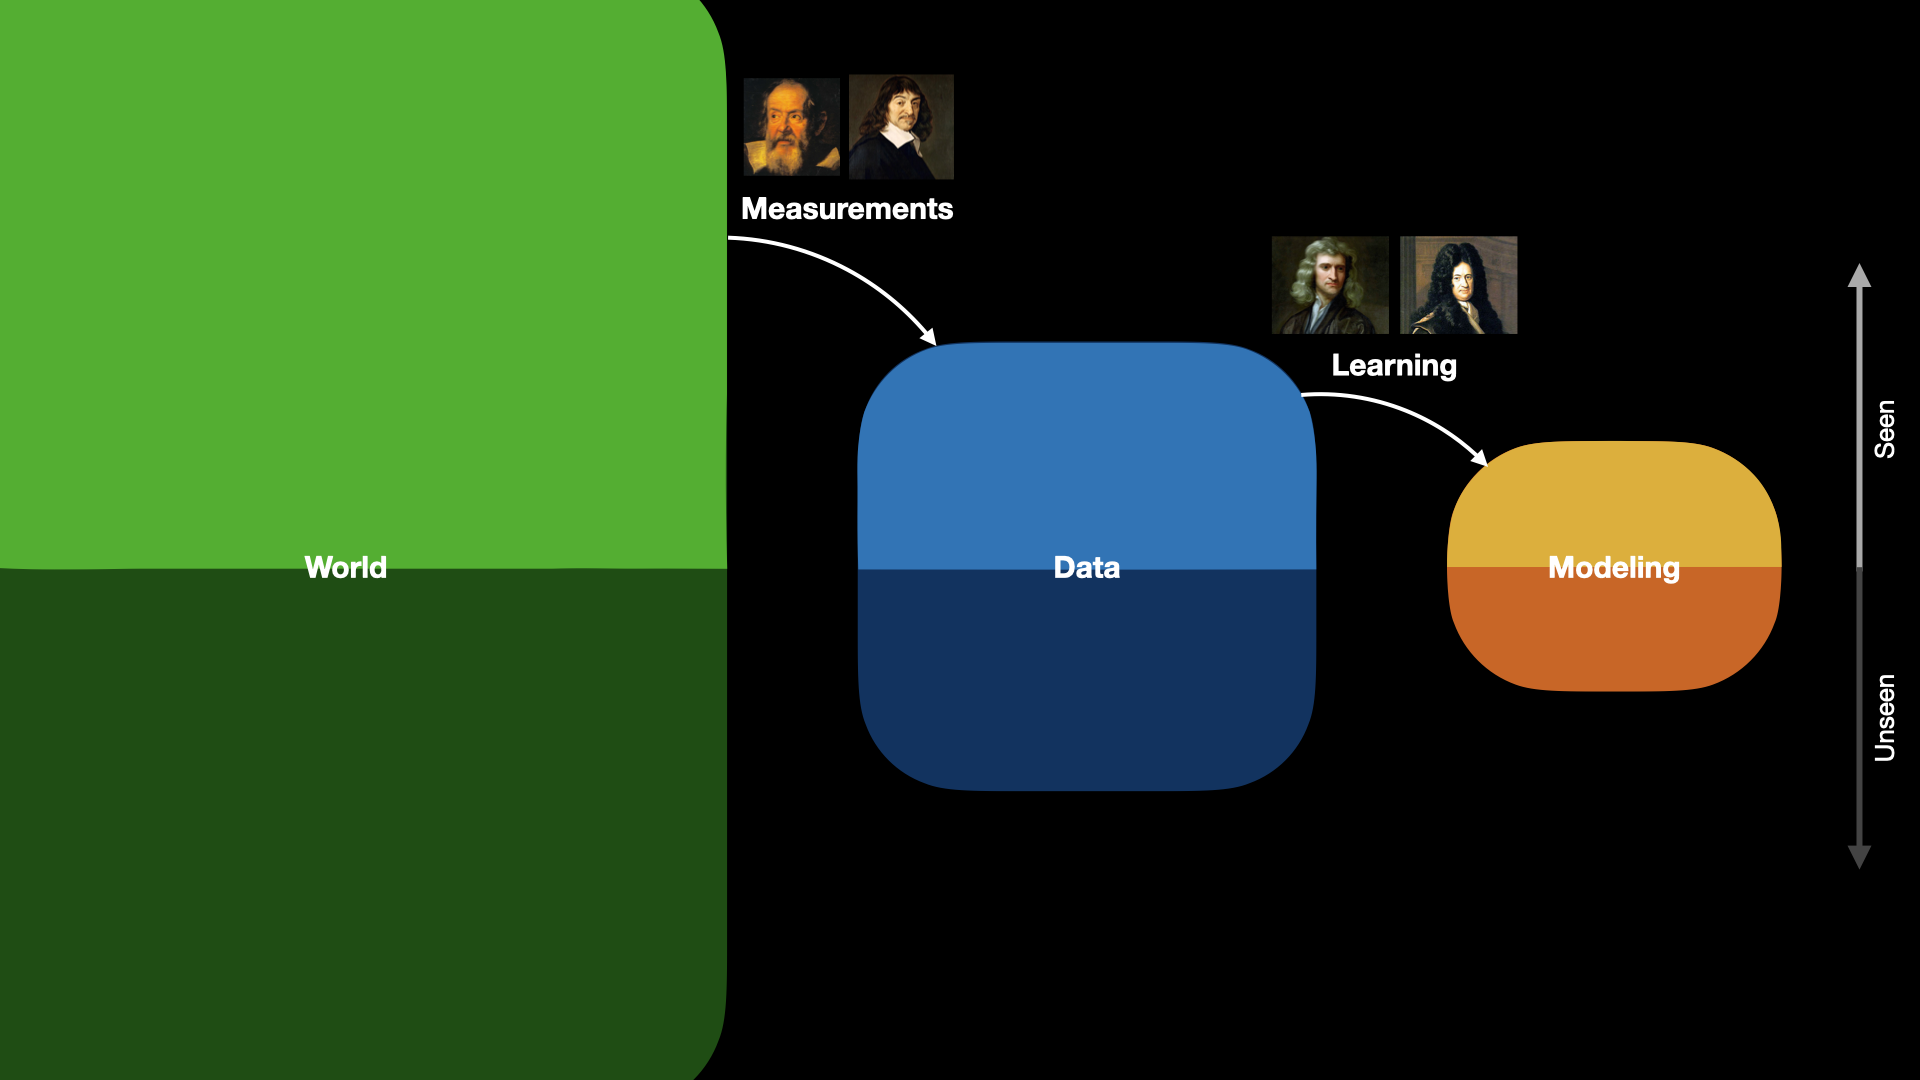
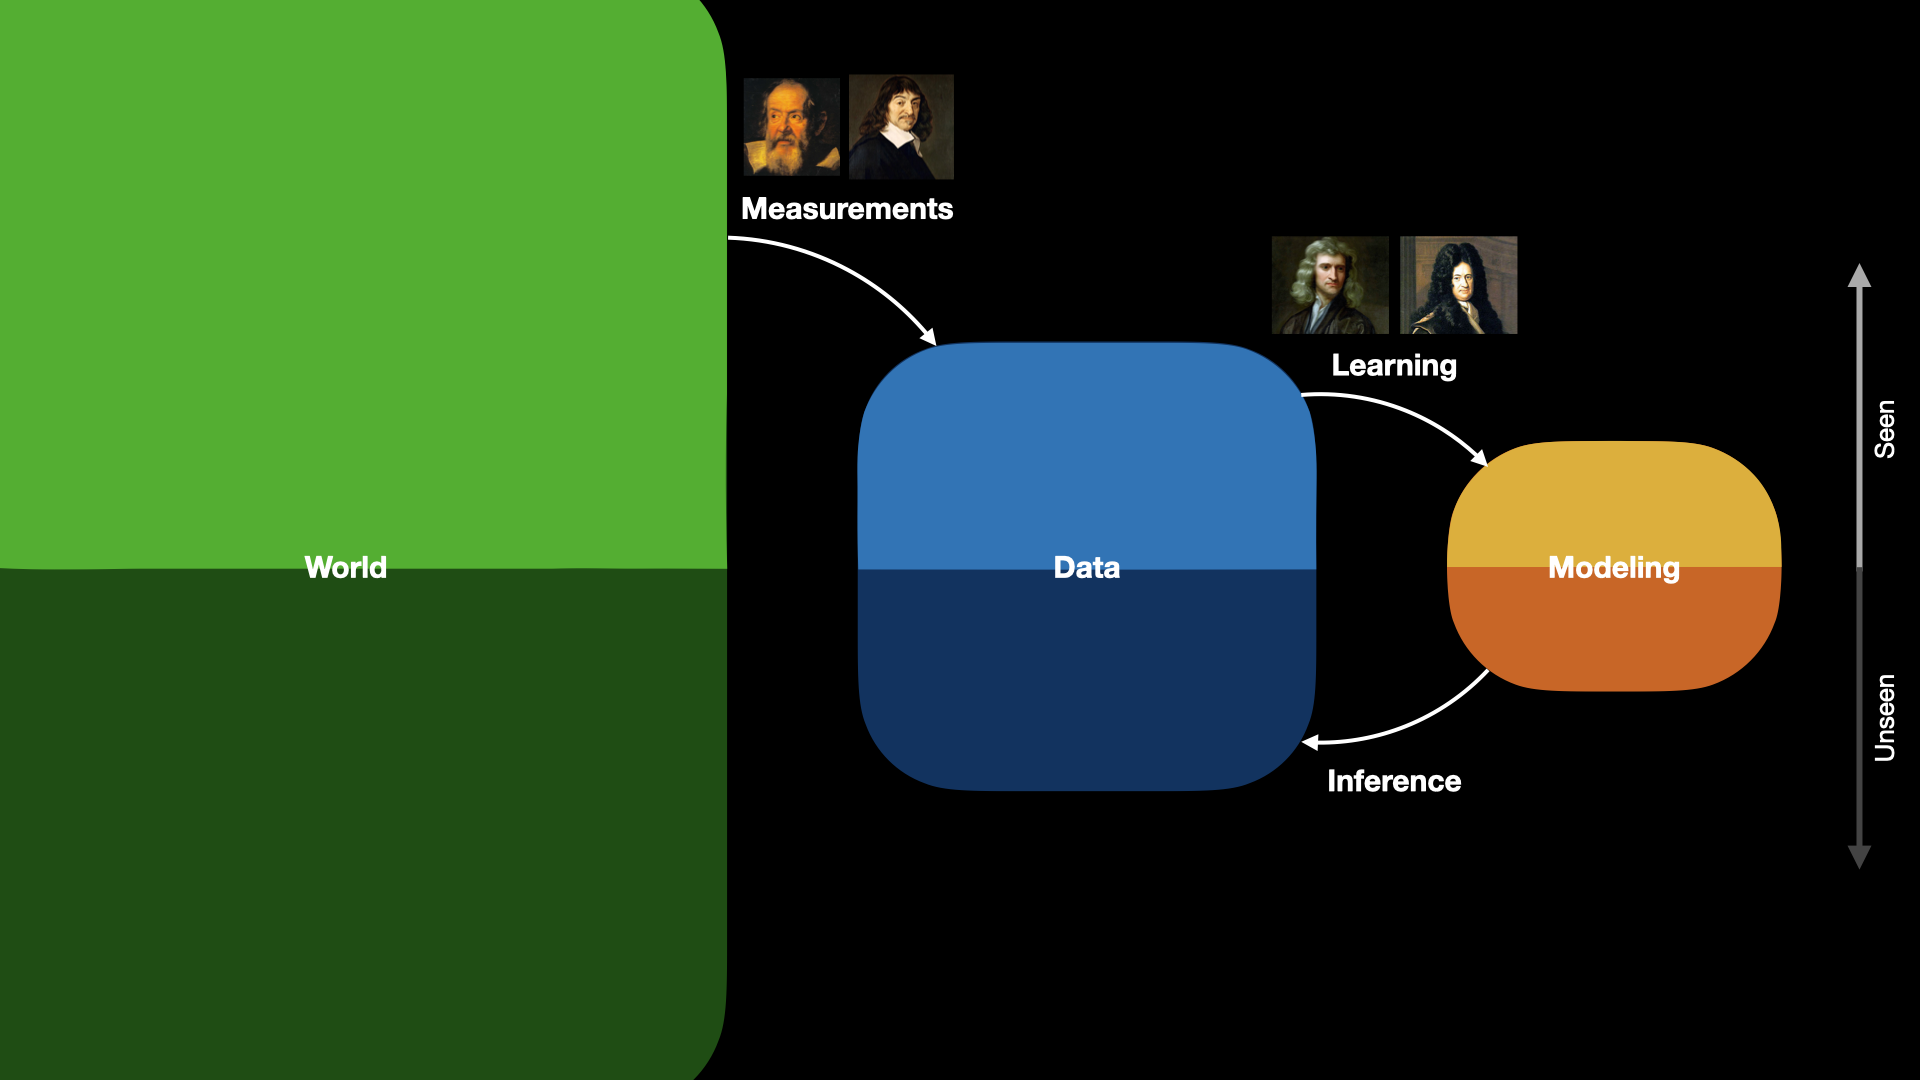
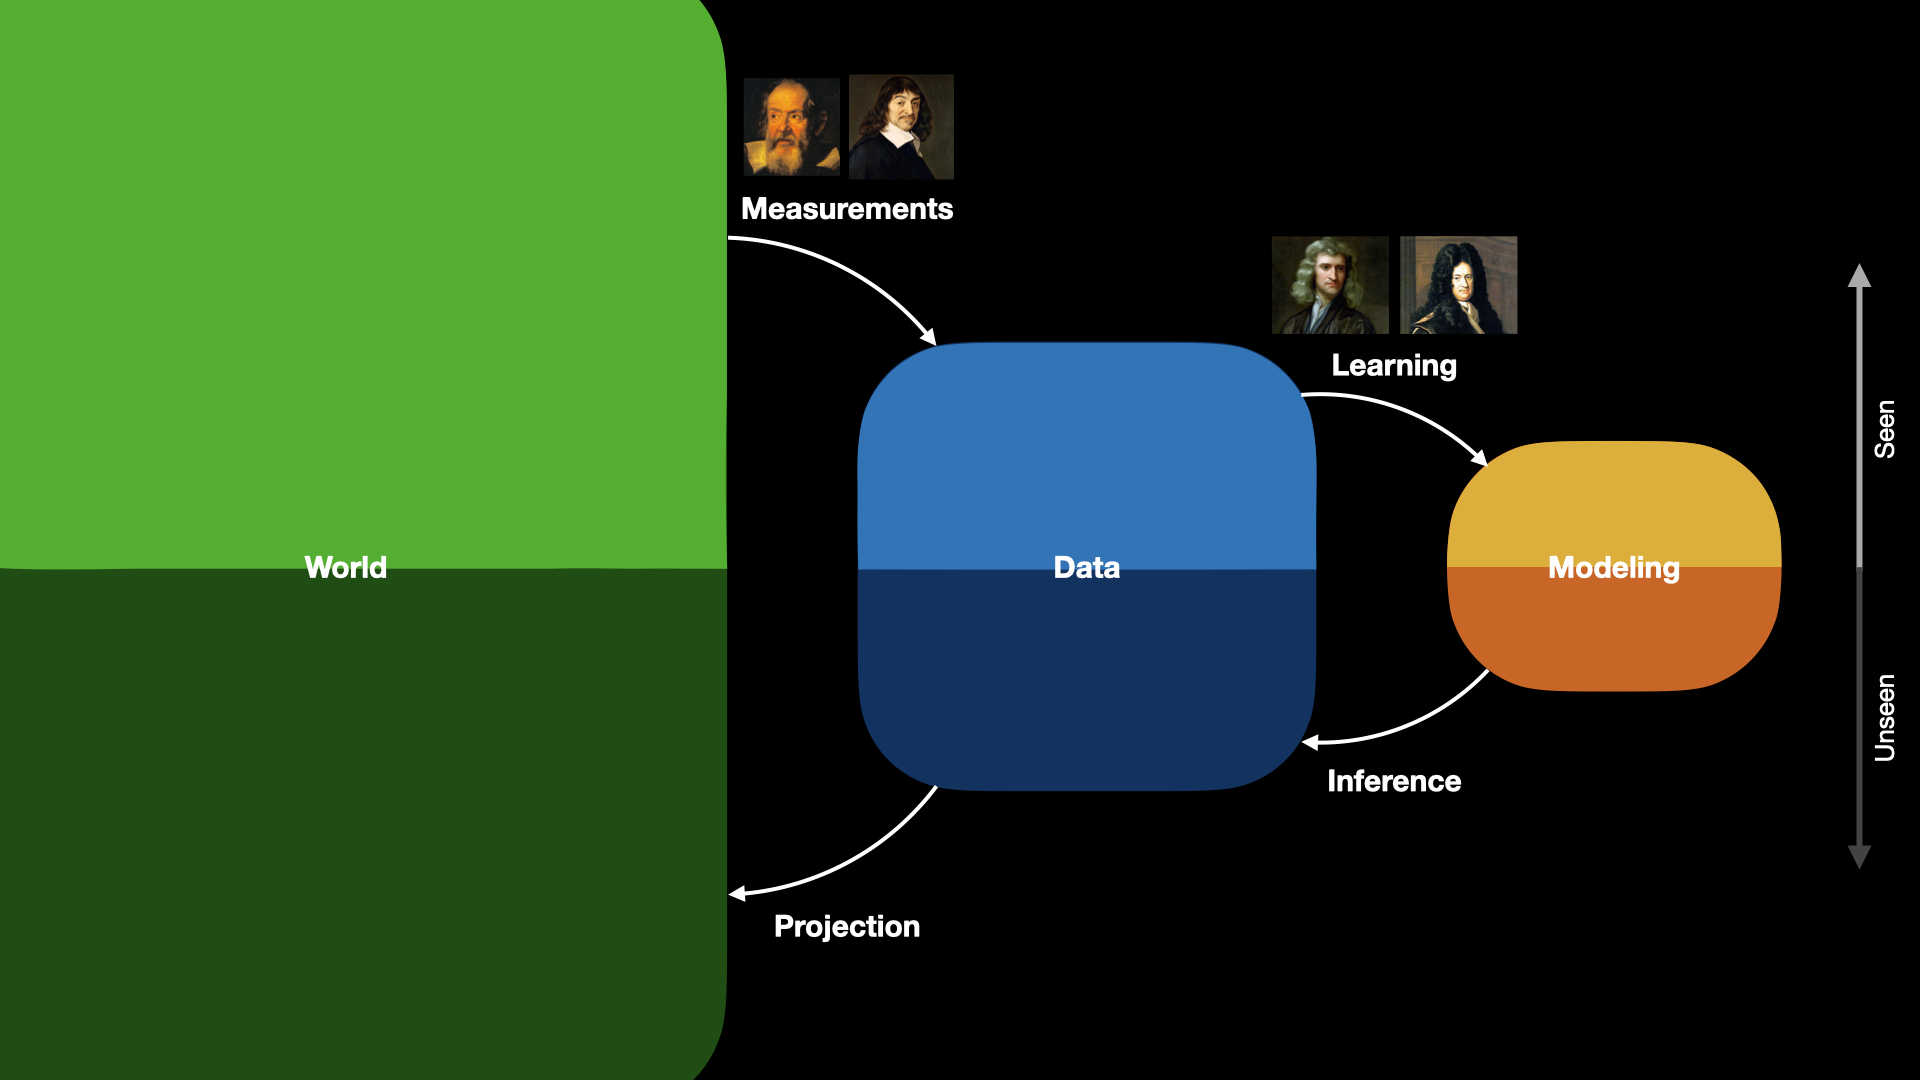
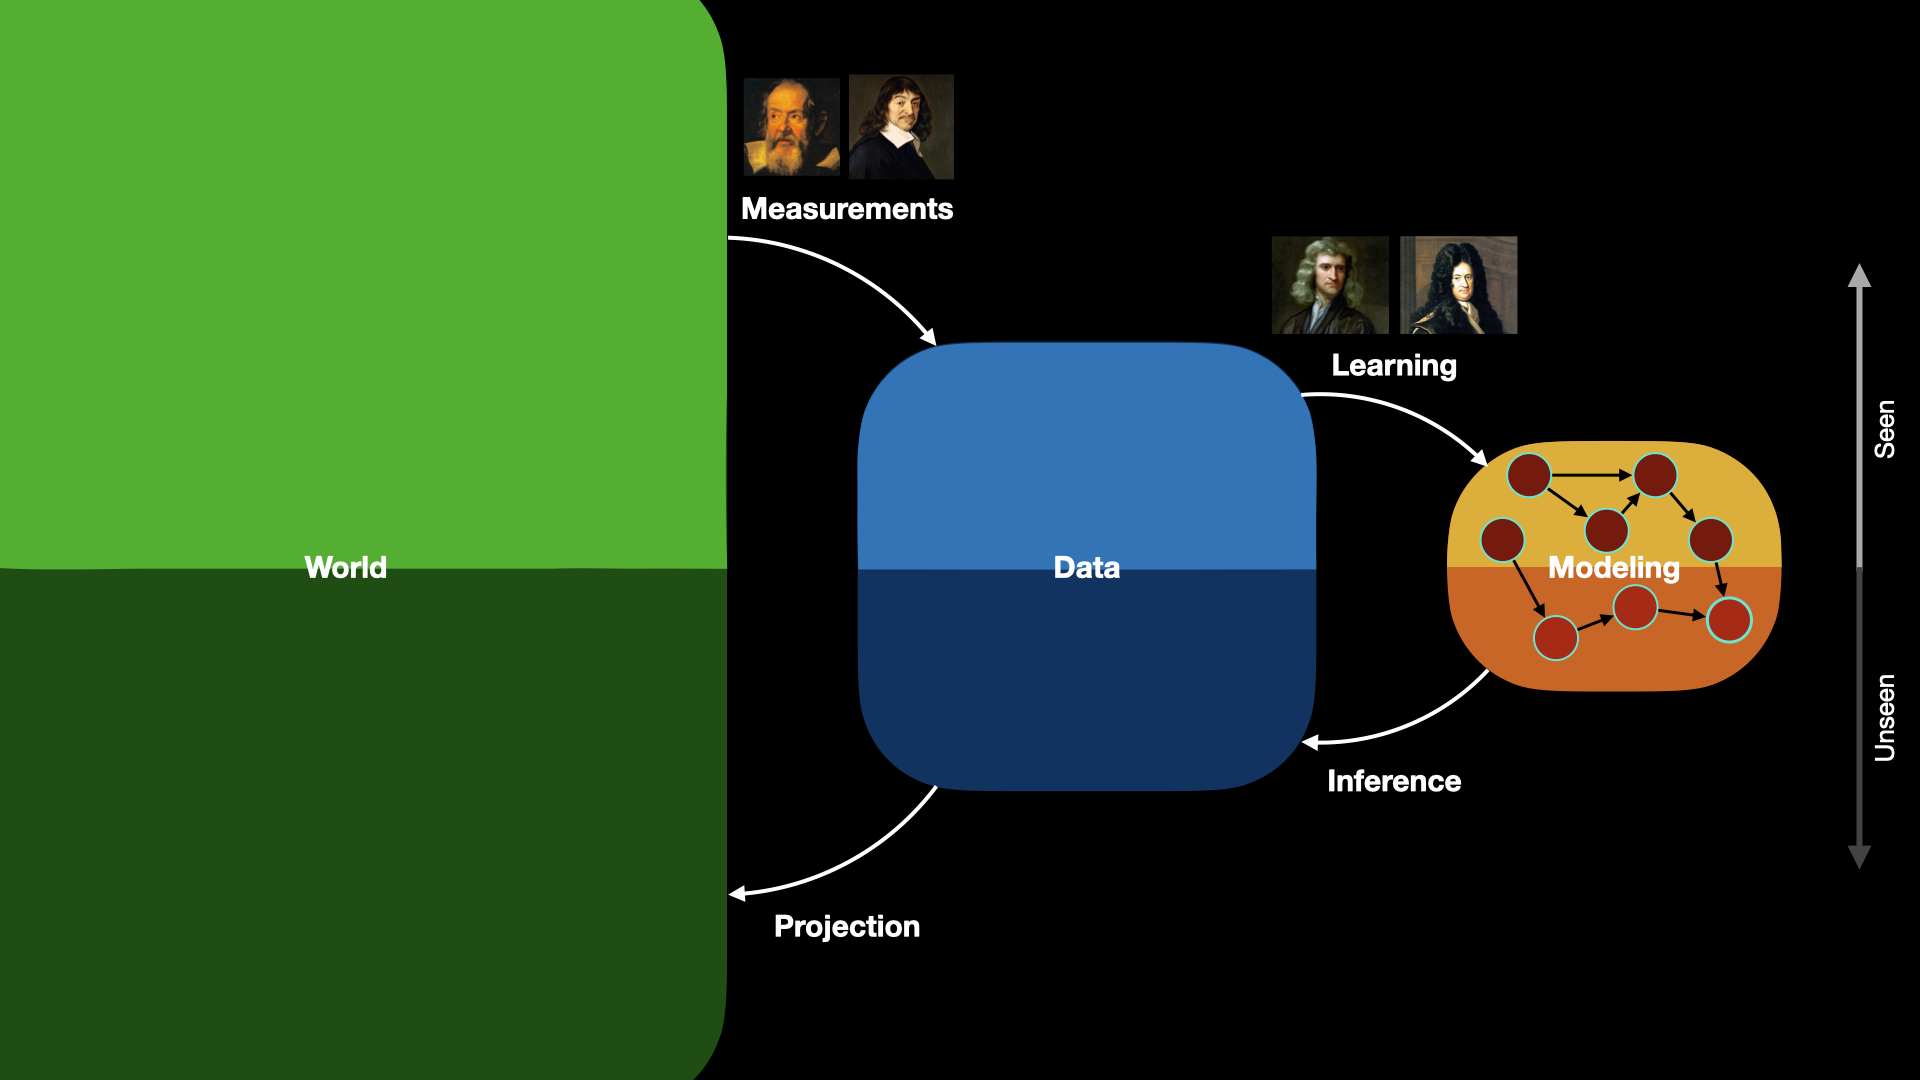
Data is the interface
between the world and the model.
Thursday: the math and Python toolkit.
Before then: PS0, and run the penguins line yourself.