From Data to Learning
Data-Driven Modeling in Science and Engineering
Announcements and Logistics
- Course site: ml4science.com. Maths and Python reference: intro2ml.com
- Assignment 0 is posted: Problem Set 0
- The purpose of this class is to learn how to learn. In fields that move this fast, papers are the medium, not textbooks.
- scholar-inbox.com, plus YouTube, blogs, and whatever else keeps you current
- The simple formula: read a paper, clone the repository, reproduce the result, come back with a question
- Main deliverable: a presentation and a paper
Finding constants of Nature That Generalize Across Space and Time
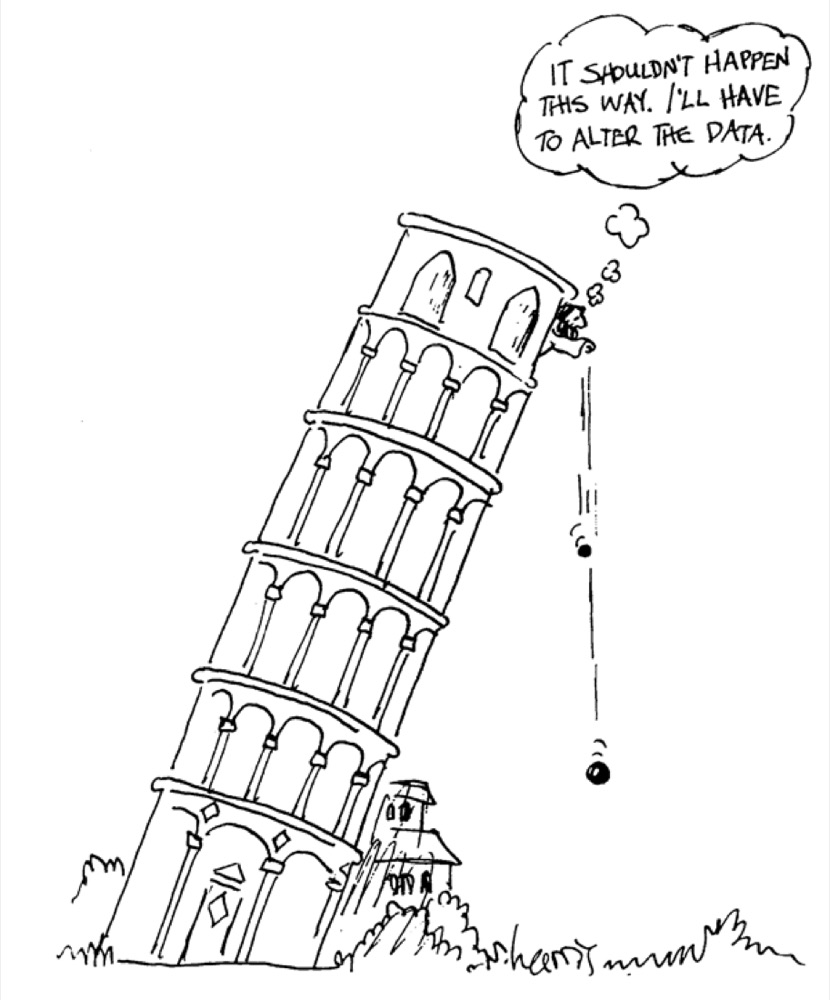
Galileo
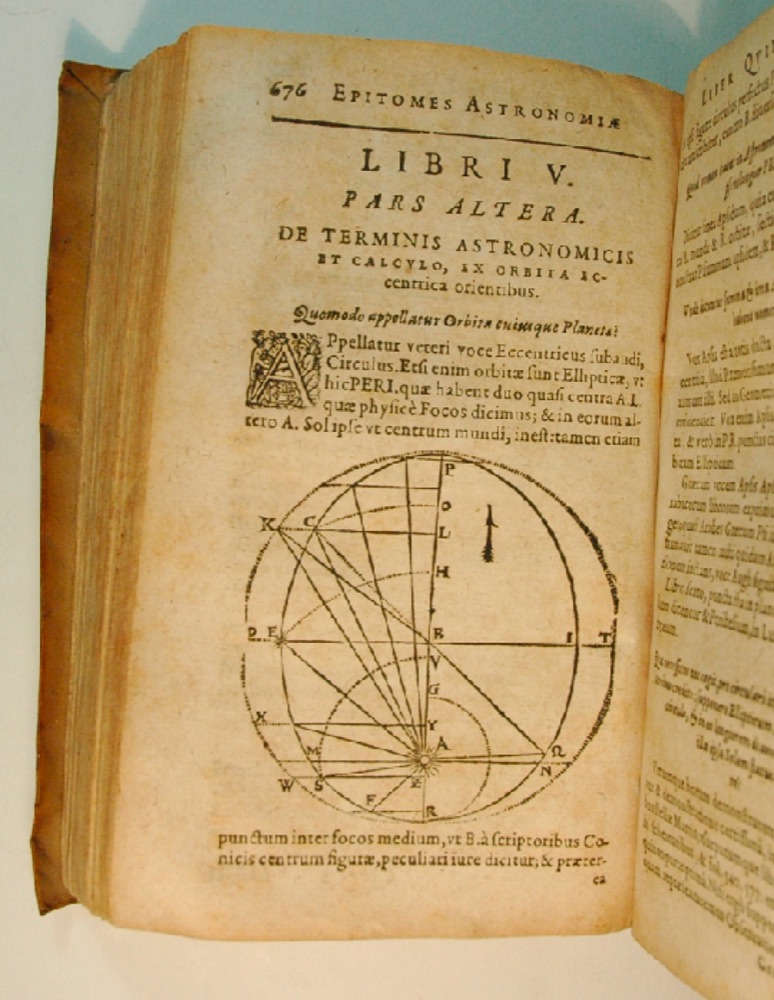
Kepler
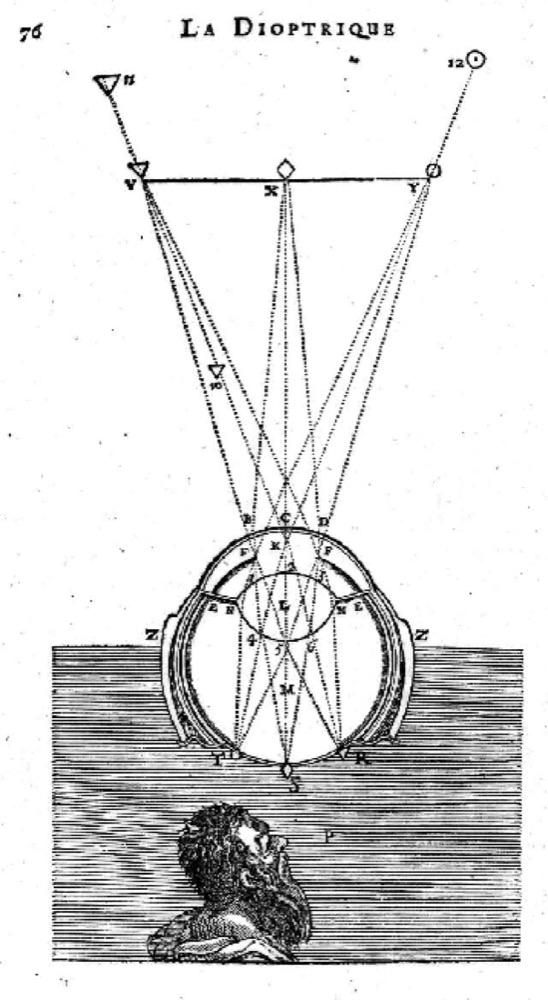
Descartes
Galileo's cartoon says the quiet part out loud: "It shouldn't happen this way. I'll have to alter the data."
From the World to a Model, and Back
The Three Pillars of Artificial Intelligence
The world is messy. The question is simple: what is the shortest way home?
The Same Three Pillars, for a Field
Now the world is a field \( u(x, t) \): a temperature, a wind speed, a concentration, known at some places and times.
SINDy, PINNs and neural operators, later in the course, are three different answers to the Learning row.
The Data Science Hierarchy of Needs
After Monica Rogati, The AI Hierarchy of Needs (2017). Five of the six layers are not machine learning: they are getting, moving and cleaning the data.
What are* data?
Anything the world leaves behind that we can record.
Today: all of these become numbers.
*one datum, many data
Stocks
hover a row
- A table and a curve: the same object
- Each row is a pair \( (t_i, x_i) \): 123 months, 123 numbers
Monthly closing prices in US dollars, January 2000 to March 2010, as published in the vega-datasets collection.
Temperature
- Global surface temperature, as the difference from the 1951 to 1980 average
- The warmest year in the record is 2024, at +1.28 °C. Every year since 2015 is warmer than any year before it.
NASA GISTEMP v4, annual means 1880 to 2025, via datasets/global-temp. Hover the bars or the table.
Audio
- Speech recognition is a function \( F: \text{array} \rightarrow \text{text} \): Siri (2011), Alexa (2014), Google Assistant (2016)
Four seconds of Heather Barnett reading Sense and Sensibility, from the LibriSpeech corpus (CC BY 4.0).
From a Wave to a Picture
The short-time Fourier transform: the first thing anyone does to a sound before modelling it
- Cut the signal into short windows, take the Fourier transform of each, stack them side by side. Now pitch is visible.
- The voice stops at 8 kHz: it was recorded at 16,000 samples per second, and no recording holds frequencies above half its sampling rate.
- Speech recognisers and birdsong classifiers almost never see the wave. They see this picture.
Robin: InspectorJ, freesound (CC BY 3.0) · whale: Chris Gabriele, Glacier Bay NPS, 2020 (public domain) · voice: LibriSpeech (CC BY 4.0)
Images
move your mouse over the image: every pixel is one number from 0 (black) to 255 (white)
- This grey image is a \( 330 \times 330 \) matrix: 108,900 numbers
- Your phone: \( 3000 \times 4000 \times 3 = 36 \) million numbers per photo
Astronaut Eileen Collins, NASA portrait (public domain), as shipped with scikit-image.
Colour Is Three Matrices
The grey image was one number per pixel. Colour is three, stacked
- A colour image of height \(h\) and width \(w\) is an array of shape \( h \times w \times 3 \).
- Nothing about it is a picture to the machine. It is three grids of numbers between 0 and 255.
Image Recognition, and What Came After
- 2010 Google announces its self-driving car project (Waymo since 2016)
- 2011 IBM Watson beats Ken Jennings and Brad Rutter at Jeopardy!
- 2012 Deep networks overtake the best speech recognisers (Hinton et al.)
- 2012 Google Brain learns to find cats in 10 million unlabelled YouTube frames
- 2012 AlexNet: ImageNet top-5 error falls from 26% to 15%
- 2014 DeepFace matches faces at 97.35% (people: 97.53%)
- 2016 Diabetic retinopathy graded from retina photos at specialist level
- 2019 Lung cancer screening CT read as well as six radiologists
- 2020 AlphaFold 2 predicts protein structure from sequence (CASP14)
- 2022 DALL-E 2 and Stable Diffusion turn text into images; ChatGPT
- 2024 One model reads text, images and sound together; text becomes video
The same training recipe each time, on new data.
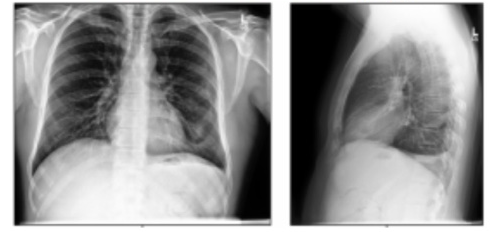
Medical images are data like any other.
Ardila et al., Nature Medicine 2019 ·
Gulshan et al., JAMA 2016
Generative Adversarial Networks (2014)
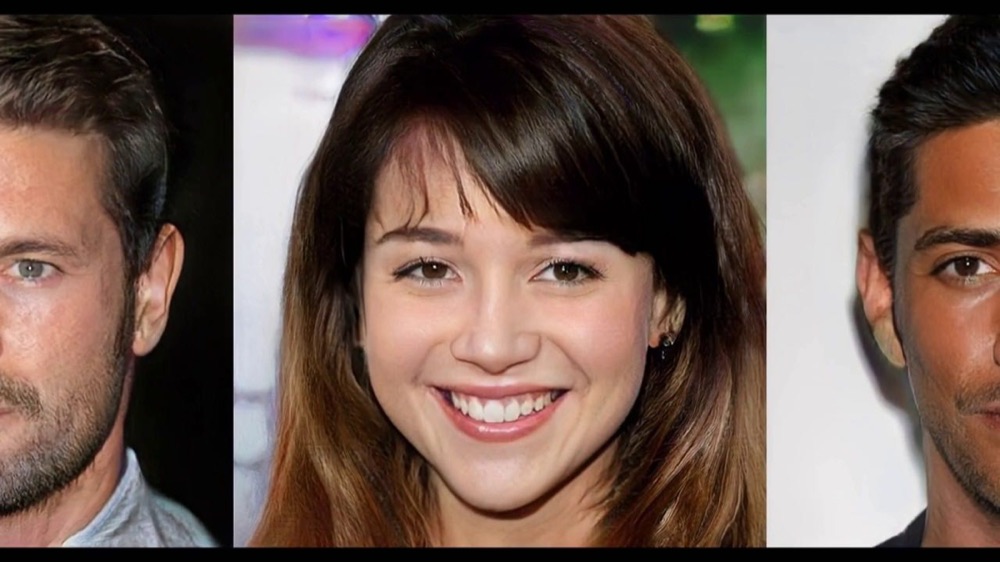
None of these people exist. GANs were introduced by Goodfellow et al. in 2014; these faces are from Karras et al., Progressive Growing of GANs for Improved Quality, Stability, and Variation (ICLR 2018). Video
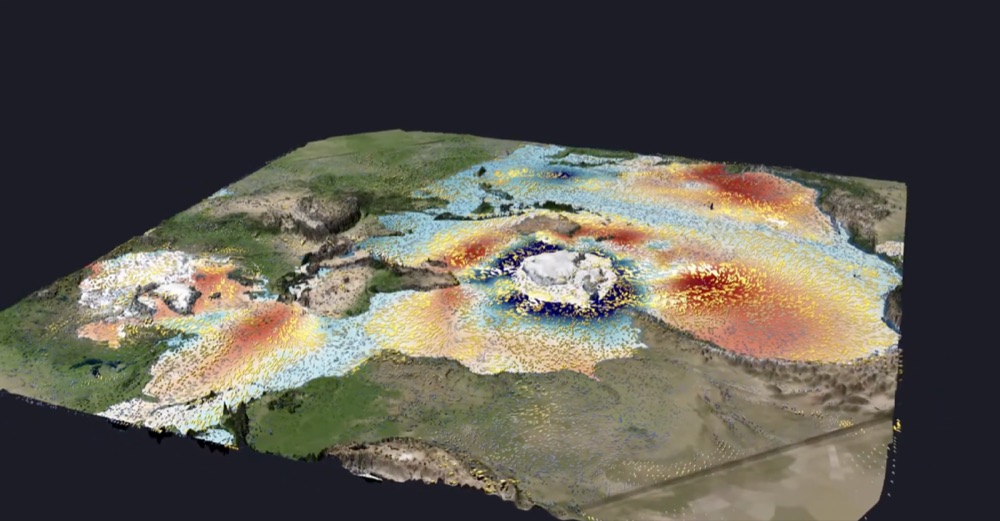
Coupled Ocean Atmosphere Simulation
Video
Eadweard Muybridge, 1878: the first time motion was recorded as an array of stills
- One frame is \( h \times w \times 3 \); a clip is \( T \times h \times w \times 3 \)
- One minute of 1080p at 30 fps: about 11 billion numbers
- Muybridge settled a bet: are all four hooves ever off the ground at once? You cannot see it, so he turned it into data.
Frames from The Horse in Motion, Wikimedia Commons, public domain.
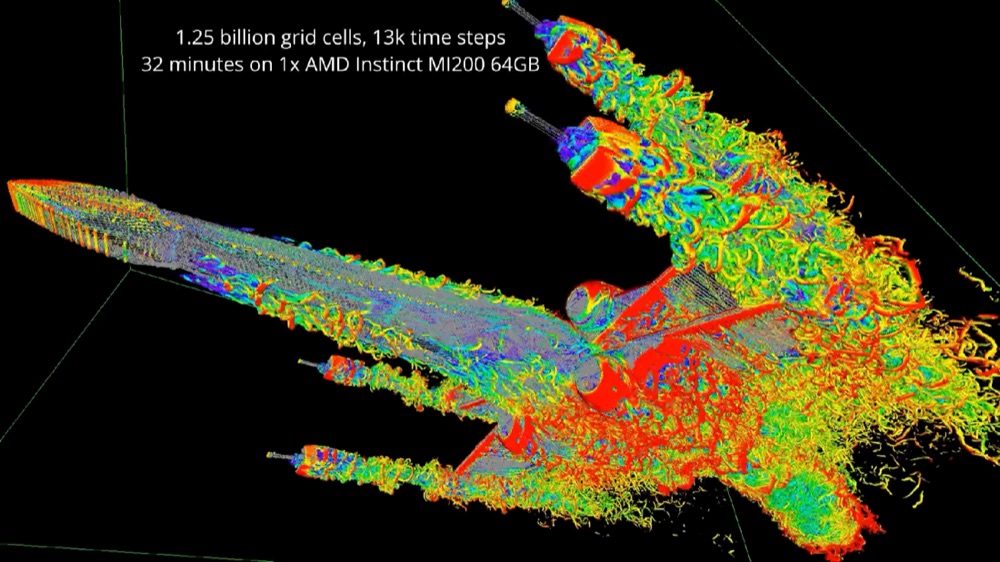
Fluid Dynamics
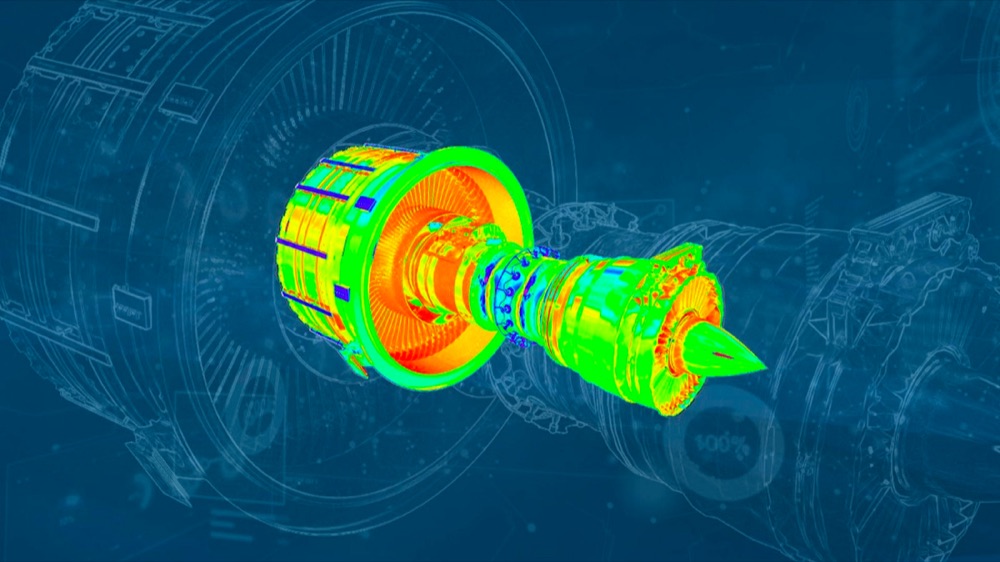
Machine Learning in Materials Research
Text
One-hot word representation
hover a word: its column lights up
- One-hot is honest but lonely: every word equally far from every other
Text
Word embedding representation: 50 numbers per word, learned from 6 billion words of text
up: the average direction from each male word to its female pair. Across: the main direction left over.
GloVe, 50 dimensions (Pennington, Socher and Manning, 2014), trained on Wikipedia and Gigaword; searched over the 5,000 most frequent words.
Text Generation
The instructor's question to Google Gemini, and its answer, as it was given.
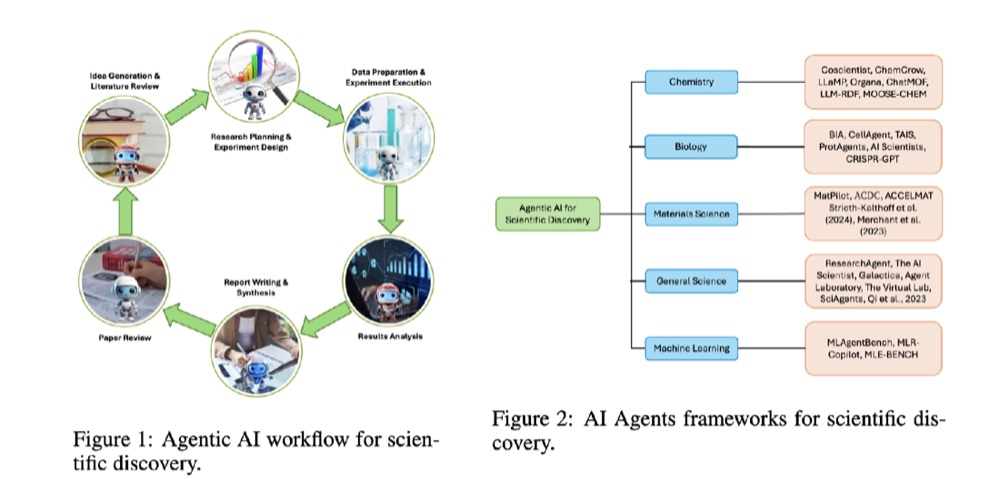
Language Models That Do Science
Games
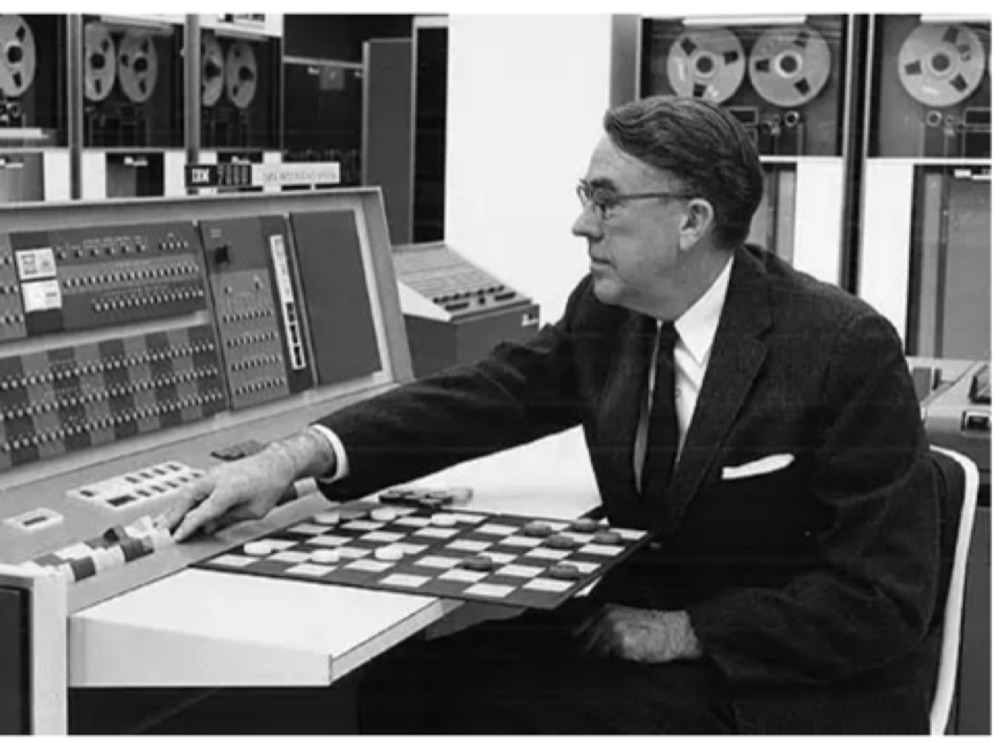
1959 · Arthur Samuel's checkers program at IBM learns from its own games. His paper that year names the field: machine learning.
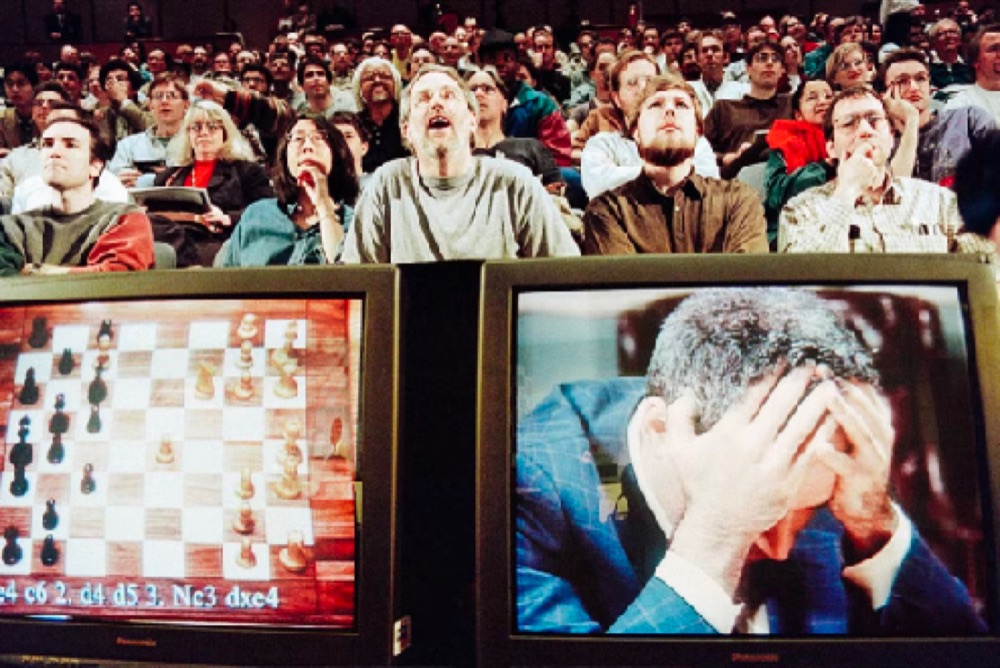
1997 · IBM Deep Blue beats world champion Garry Kasparov, 3.5 to 2.5. It searched about 200 million positions a second.
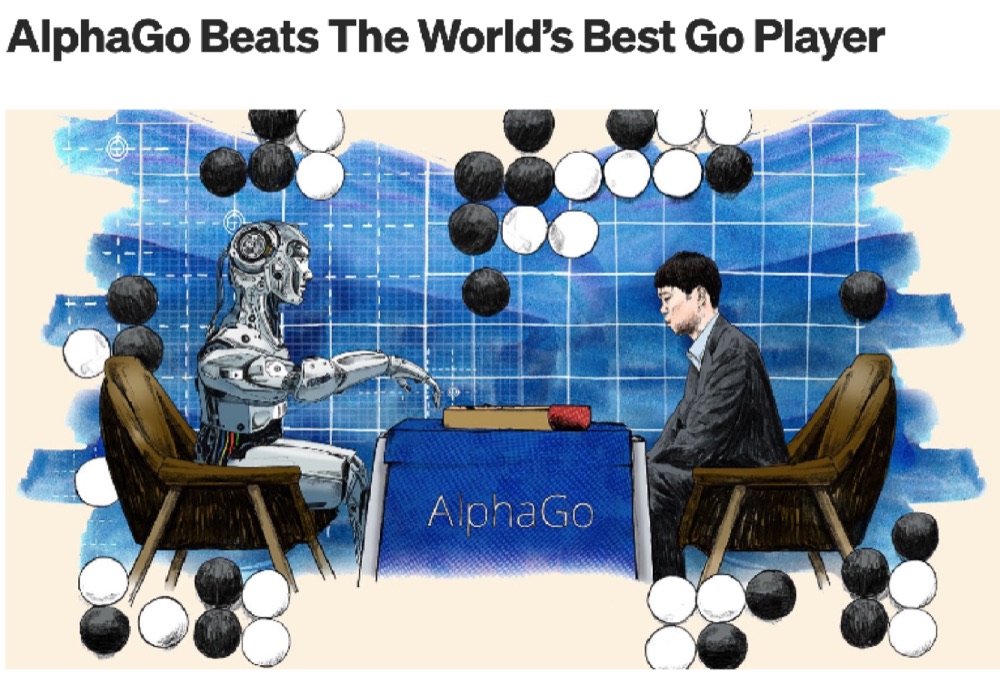
2016 · DeepMind's AlphaGo beats Lee Sedol, 4 games to 1. Go cannot be searched; it learned what good positions look like.
Solving Puzzles: How Big Is the Search?
Past about \(10^{20}\), nothing is solved by listing positions. Past \(10^{80}\), there are not enough atoms in the universe to write them down. You have to learn the structure instead.
Counts: Tromp (Connect Four, chess, Go); Schaeffer et al., Science 2007 (checkers); Rokicki et al. 2010 (Rubik's cube); Felgenhauer and Jarvis 2005 (sudoku); Shannon 1950 (chess games).
Graph Representation
- Maps, molecules, social networks: all matrices, \( A_{ij} = 1 \) when \(i\) connects to \(j\)
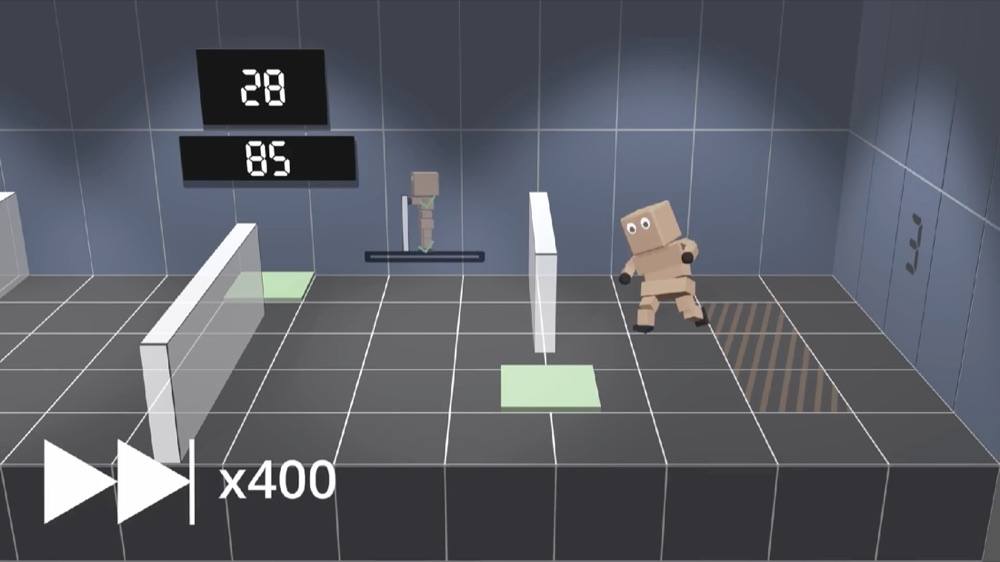
Robotics and Games: Reinforcement Learning
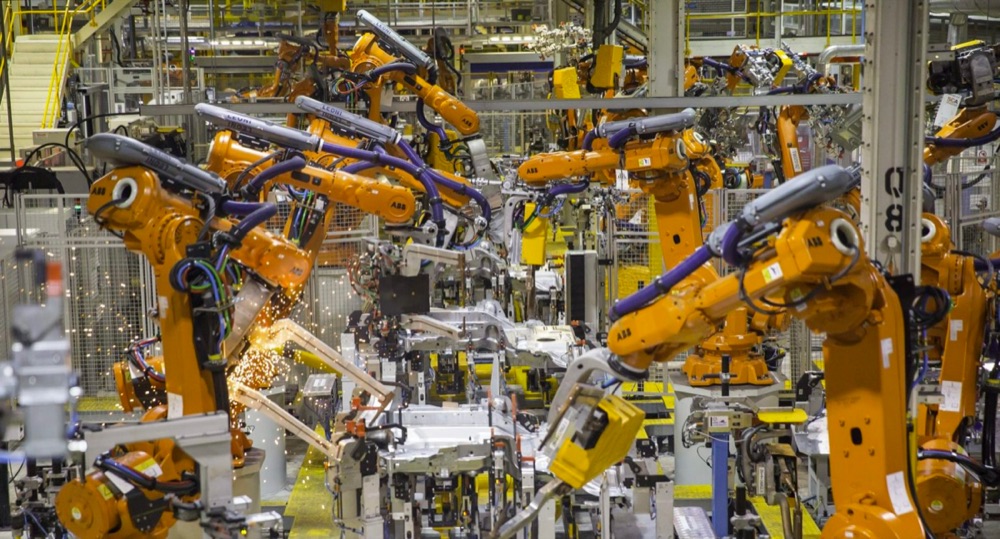
Robotics and Manufacturing
Robotics
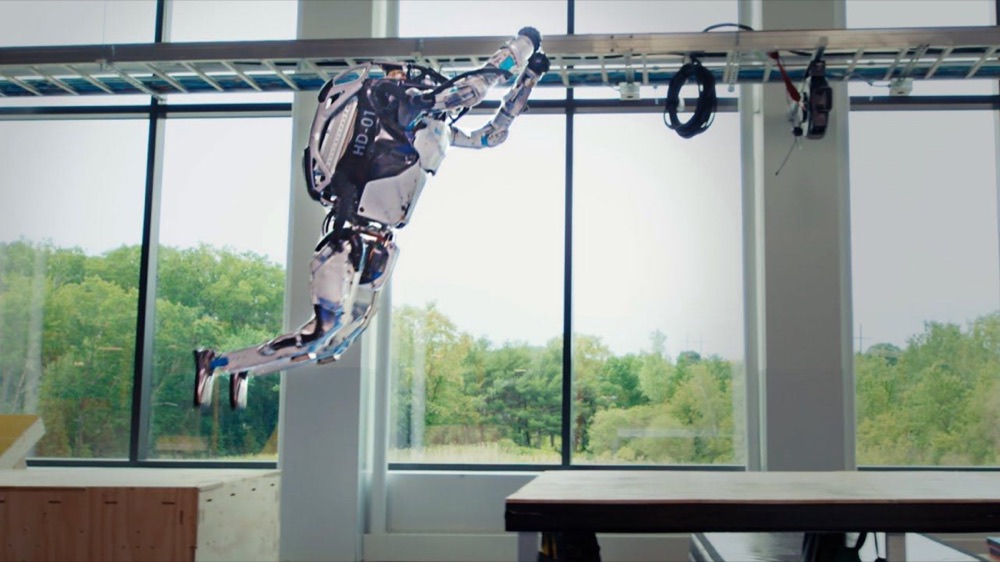
Boston Dynamics · youtube.com/watch?v=tF4DML7FIWk
Classification, Regression, Structured Prediction
Same skeleton every time. Only the shape of \(y\) changes. Now you: one input-output pair from your own life. Which of the three is it?
Data Analysis
Before a model, the summaries: what one variable does, and what two of them do together.
Correlation Coefficient (2 Variables)
- Linear co-movement, from \( -1 \) to \( +1 \)
- \( r = 0 \) means not linear, not unrelated
Correlation Matrix (Multiple Variables)
\( r_{ij} = \mathrm{Cov}(X_i, X_j) / (\sigma_{X_i} \sigma_{X_j}) \): every pair at once, the diagonal all ones. Click a cell to see its pair.
Palmer Penguins: Gorman, Williams and Fraser (2014), Palmer Station LTER; 342 birds with all four measurements.
Histogram and Probability Density Function
Galton (1885), 928 children, inches; De Cock (2011), 2,930 Ames sales; Open-Meteo ERA5, Beirut, 4,018 days of 2015 to 2025.
Box and Whisker Plot
Five numbers instead of a histogram: minimum, lower quartile, median, upper quartile, maximum. Half the birds sit inside each box.
Where to Look for Data?
- Curated: Kaggle, UCI, Hugging Face, data.gov
- Collected: sensors, experiments, your phone
- Scraped: the web, politely
- Asked: a language model will name datasets you would not have found, and invent ones that do not exist. Check every link it gives you.
import pandas as pd

url = "https://raw.githubusercontent.com/mwaskom/seaborn-data/master/penguins.csv"
df = pd.read_csv(url)

print(df.shape)        # (344, 7): 344 penguins, 7 measurements
print(df.describe())   # your first look at any dataset
How Do You Come Up With Project Ideas?
- Start from something you already care about, then go looking for whether anyone has measured it
- Search properly: Google, Google Scholar, and ask a model to argue with you about it
- Read a paper, clone the repository, reproduce the result. The gap between what the paper claims and what the code does is where the project ideas live.
- A good idea names its data before it names its method.
Next session
Data is the interface
between the world and the model.
Thursday: the math and Python toolkit.
Before then: PS0, and run the penguins line yourself.